Target Information
| Target General Information | Top | |||||
|---|---|---|---|---|---|---|
| Target ID |
T90989
(Former ID: TTDNC00621)
|
|||||
| Target Name |
Fibroblast growth factor receptor 4 (FGFR4)
|
|||||
| Synonyms |
TKF; JTK2; FGFR-4; CD334
Click to Show/Hide
|
|||||
| Gene Name |
FGFR4
|
|||||
| Target Type |
Clinical trial target
|
[1] | ||||
| Disease | [+] 1 Target-related Diseases | + | ||||
| 1 | Liver cancer [ICD-11: 2C12] | |||||
| Function |
Required for normal down-regulation of the expression of CYP7A1, the rate-limiting enzyme in bile acid synthesis, in response to FGF19. Phosphorylates PLCG1 and FRS2. Ligand binding leads to the activation of several signaling cascades. Activation of PLCG1 leads to the production of the cellular signaling molecules diacylglycerol and inositol 1,4,5-trisphosphate. Phosphorylation of FRS2 triggers recruitment of GRB2, GAB1, PIK3R1 and SOS1, and mediates activation of RAS, MAPK1/ERK2, MAPK3/ERK1 and the MAP kinase signaling pathway, as well as of the AKT1 signaling pathway. Promotes SRC-dependent phosphorylation of the matrix protease MMP14 and its lysosomal degradation. FGFR4 signaling is down-regulated by receptor internalization and degradation; MMP14 promotes internalization and degradation of FGFR4. Mutations that lead to constitutive kinase activation or impair normal FGFR4 inactivation lead to aberrant signaling. Tyrosine-protein kinase that acts as cell-surface receptor for fibroblast growth factors and plays a role in the regulation of cell proliferation, differentiation and migration, and in regulation of lipid metabolism, bile acid biosynthesis, glucose uptake, vitamin D metabolism and phosphate homeostasis.
Click to Show/Hide
|
|||||
| BioChemical Class |
Kinase
|
|||||
| UniProt ID | ||||||
| EC Number |
EC 2.7.10.1
|
|||||
| Sequence |
MRLLLALLGVLLSVPGPPVLSLEASEEVELEPCLAPSLEQQEQELTVALGQPVRLCCGRA
ERGGHWYKEGSRLAPAGRVRGWRGRLEIASFLPEDAGRYLCLARGSMIVLQNLTLITGDS LTSSNDDEDPKSHRDPSNRHSYPQQAPYWTHPQRMEKKLHAVPAGNTVKFRCPAAGNPTP TIRWLKDGQAFHGENRIGGIRLRHQHWSLVMESVVPSDRGTYTCLVENAVGSIRYNYLLD VLERSPHRPILQAGLPANTTAVVGSDVELLCKVYSDAQPHIQWLKHIVINGSSFGADGFP YVQVLKTADINSSEVEVLYLRNVSAEDAGEYTCLAGNSIGLSYQSAWLTVLPEEDPTWTA AAPEARYTDIILYASGSLALAVLLLLAGLYRGQALHGRHPRPPATVQKLSRFPLARQFSL ESGSSGKSSSSLVRGVRLSSSGPALLAGLVSLDLPLDPLWEFPRDRLVLGKPLGEGCFGQ VVRAEAFGMDPARPDQASTVAVKMLKDNASDKDLADLVSEMEVMKLIGRHKNIINLLGVC TQEGPLYVIVECAAKGNLREFLRARRPPGPDLSPDGPRSSEGPLSFPVLVSCAYQVARGM QYLESRKCIHRDLAARNVLVTEDNVMKIADFGLARGVHHIDYYKKTSNGRLPVKWMAPEA LFDRVYTHQSDVWSFGILLWEIFTLGGSPYPGIPVEELFSLLREGHRMDRPPHCPPELYG LMRECWHAAPSQRPTFKQLVEALDKVLLAVSEEYLDLRLTFGPYSPSGGDASSTCSSSDS VFSHDPLPLGSSSFPFGSGVQT Click to Show/Hide
|
|||||
| 3D Structure | Click to Show 3D Structure of This Target | AlphaFold | ||||
| HIT2.0 ID | T70NYW | |||||
| Drugs and Modes of Action | Top | |||||
|---|---|---|---|---|---|---|
| Clinical Trial Drug(s) | [+] 1 Clinical Trial Drugs | + | ||||
| 1 | INCB62079 | Drug Info | Phase 1/2 | Liver cancer | [2] | |
| Mode of Action | [+] 1 Modes of Action | + | ||||
| Inhibitor | [+] 2 Inhibitor drugs | + | ||||
| 1 | INCB62079 | Drug Info | [2] | |||
| 2 | ACTB-1003 | Drug Info | [1] | |||
| Cell-based Target Expression Variations | Top | |||||
|---|---|---|---|---|---|---|
| Cell-based Target Expression Variations | ||||||
| Drug Binding Sites of Target | Top | |||||
|---|---|---|---|---|---|---|
| Ligand Name: Ponatinib | Ligand Info | |||||
| Structure Description | FGFR4 in complex with Ponatinib | PDB:4UXQ | ||||
| Method | X-ray diffraction | Resolution | 1.85 Å | Mutation | Yes | [3] |
| PDB Sequence |
LDLPLDPLWE
461 FPRDRLVLGK471 PLGEGAFGQV481 VRAEAFGMDP491 ARPDQASTVA501 VKMLKDNASD 511 KDLADLVSEM521 EVMKLIGRHK531 NIINLLGVCT541 QEGPLYVIVE551 CAAKGNLREF 561 LRARRPPGPL584 SFPVLVSCAY594 QVARGMQYLE604 SRKCIHRDLA614 ARNVLVTEDN 624 VMKIADFGLA634 RGVHHIDYYK644 KTSNGRLPVK654 WMAPEALFDR664 VYTHQSDVWS 674 FGILLWEIFT684 LGGSPYPGIP694 VEELFSLLRE704 GHRMDRPPHC714 PPELYGLMRE 724 CWHAAPSQRP734 TFKQLVEALD744 KVLLAV
|
|||||
|
|
LEU473
3.668
VAL481
3.709
ALA501
3.362
VAL502
3.879
LYS503
3.520
GLU520
3.387
VAL523
4.033
MET524
3.300
ILE527
3.410
ILE533
4.763
ILE534
3.580
VAL548
3.848
VAL550
3.483
GLU551
3.549
|
|||||
| Click to View More Binding Site Information of This Target and Ligand Pair | ||||||
| Ligand Name: TKI258 | Ligand Info | |||||
| Structure Description | Structural analysis of the human Fibroblast Growth Factor Receptor 4 | PDB:4TYI | ||||
| Method | X-ray diffraction | Resolution | 3.40 Å | Mutation | No | [4] |
| PDB Sequence |
SAGLVSLDLP
455 LDPLWEFPRD465 RLVLGKPLGE475 GCFGQVVRAE485 AFGMDPARPD495 QASTVAVKML 505 KDNASDKDLA515 DLVSEMEVMK525 LIGRHKNIIN535 LLGVCTQEGP545 LYVIVECAAK 555 GNLREFLRAR565 RPPPLSFPVL589 VSCAYQVARG599 MQYLESRKCI609 HRDLAARNVL 619 VTEDNVMKIA629 DFGLARGLPV653 KWMAPEALFD663 RVYTHQSDVW673 SFGILLWEIF 683 TLGGSPYPGI693 PVEELFSLLR703 EGHRMDRPPH713 CPPELYGLMR723 ECWHAAPSQR 733 PTFKQLVEAL743 DKVLLAV
|
|||||
|
|
||||||
| Click to View More Binding Site Information of This Target with Different Ligands | ||||||
| Different Human System Profiles of Target | Top |
|---|---|
|
Human Similarity Proteins
of target is determined by comparing the sequence similarity of all human proteins with the target based on BLAST. The similarity proteins for a target are defined as the proteins with E-value < 0.005 and outside the protein families of the target.
A target that has fewer human similarity proteins outside its family is commonly regarded to possess a greater capacity to avoid undesired interactions and thus increase the possibility of finding successful drugs
(Brief Bioinform, 21: 649-662, 2020).
Human Tissue Distribution
of target is determined from a proteomics study that quantified more than 12,000 genes across 32 normal human tissues. Tissue Specificity (TS) score was used to define the enrichment of target across tissues.
The distribution of targets among different tissues or organs need to be taken into consideration when assessing the target druggability, as it is generally accepted that the wider the target distribution, the greater the concern over potential adverse effects
(Nat Rev Drug Discov, 20: 64-81, 2021).
Human Pathway Affiliation
of target is determined by the life-essential pathways provided on KEGG database. The target-affiliated pathways were defined based on the following two criteria (a) the pathways of the studied target should be life-essential for both healthy individuals and patients, and (b) the studied target should occupy an upstream position in the pathways and therefore had the ability to regulate biological function.
Targets involved in a fewer pathways have greater likelihood to be successfully developed, while those associated with more human pathways increase the chance of undesirable interferences with other human processes
(Pharmacol Rev, 58: 259-279, 2006).
Biological Network Descriptors
of target is determined based on a human protein-protein interactions (PPI) network consisting of 9,309 proteins and 52,713 PPIs, which were with a high confidence score of ≥ 0.95 collected from STRING database.
The network properties of targets based on protein-protein interactions (PPIs) have been widely adopted for the assessment of target’s druggability. Proteins with high node degree tend to have a high impact on network function through multiple interactions, while proteins with high betweenness centrality are regarded to be central for communication in interaction networks and regulate the flow of signaling information
(Front Pharmacol, 9, 1245, 2018;
Curr Opin Struct Biol. 44:134-142, 2017).
Human Similarity Proteins
Human Tissue Distribution
Human Pathway Affiliation
Biological Network Descriptors
|
|
|
Note:
If a protein has TS (tissue specficity) scores at least in one tissue >= 2.5, this protein is called tissue-enriched (including tissue-enriched-but-not-specific and tissue-specific). In the plots, the vertical lines are at thresholds 2.5 and 4.
|
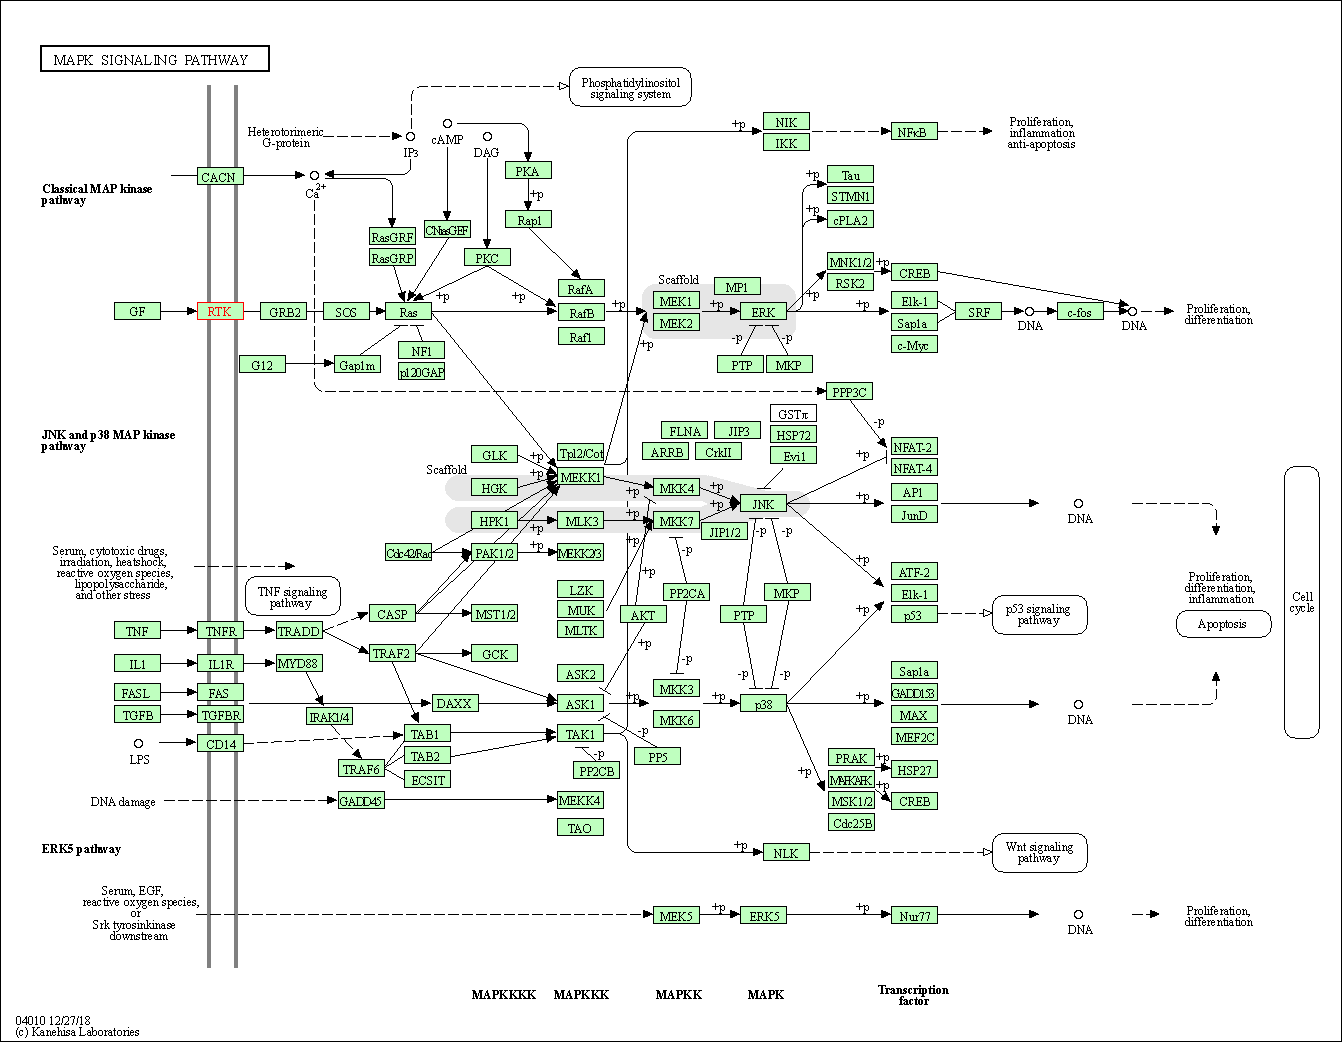
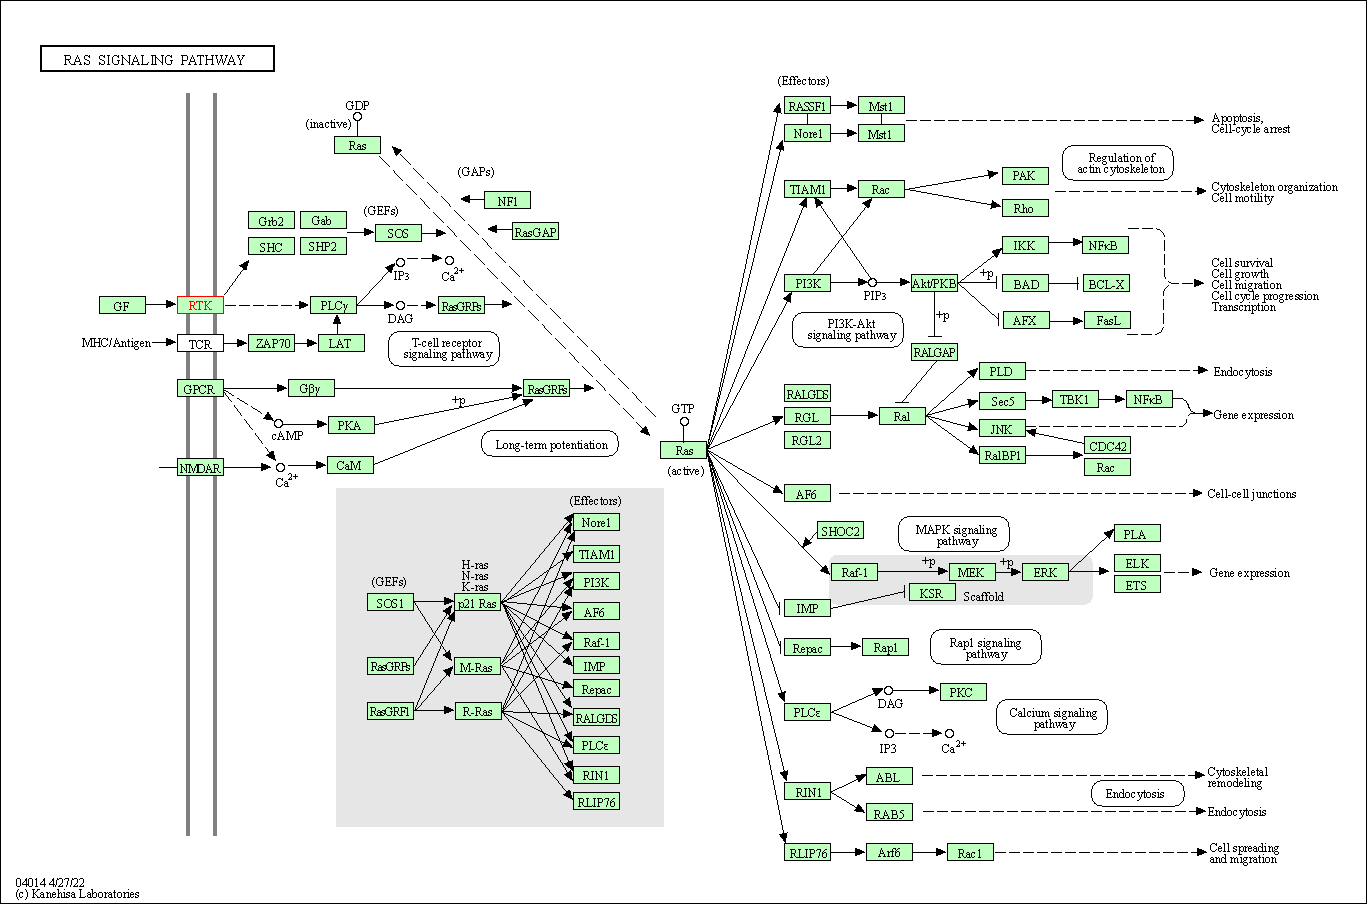
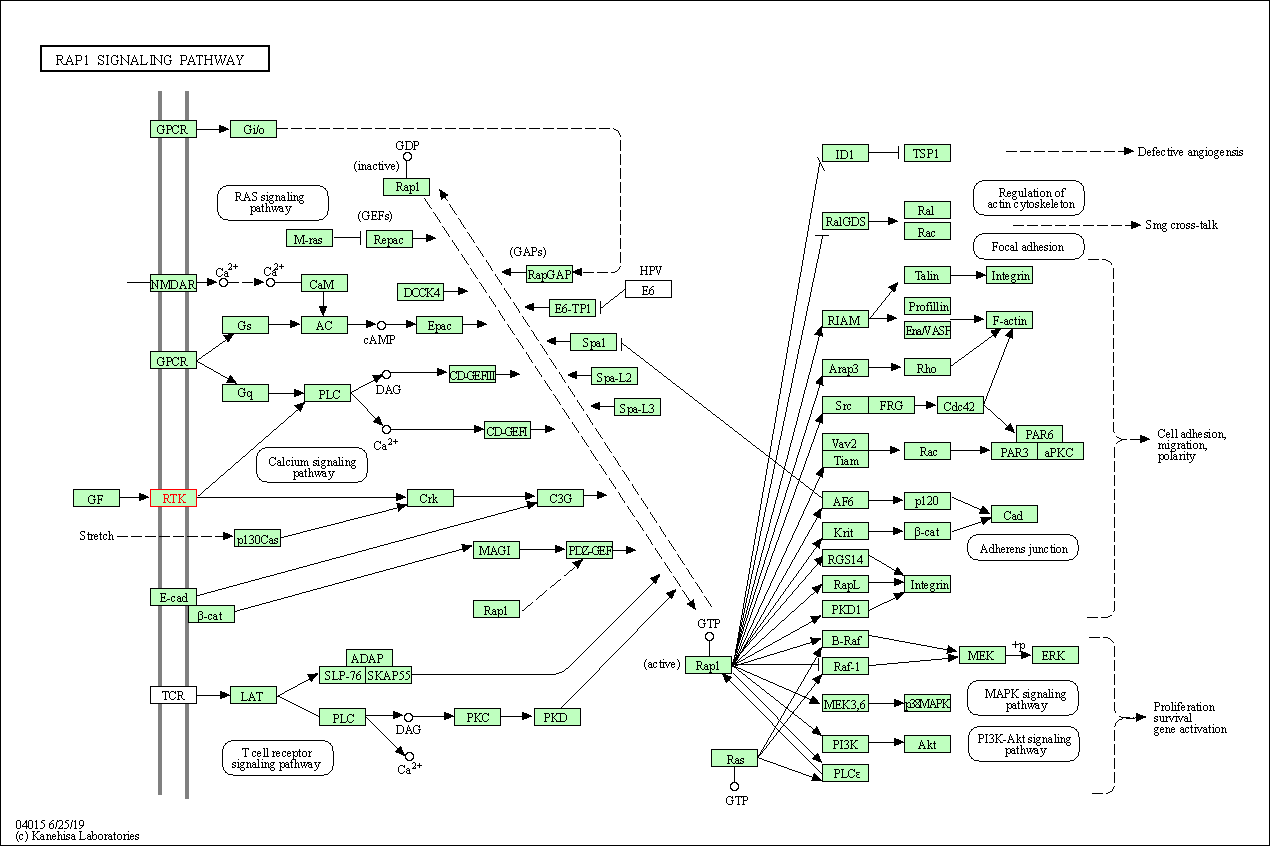

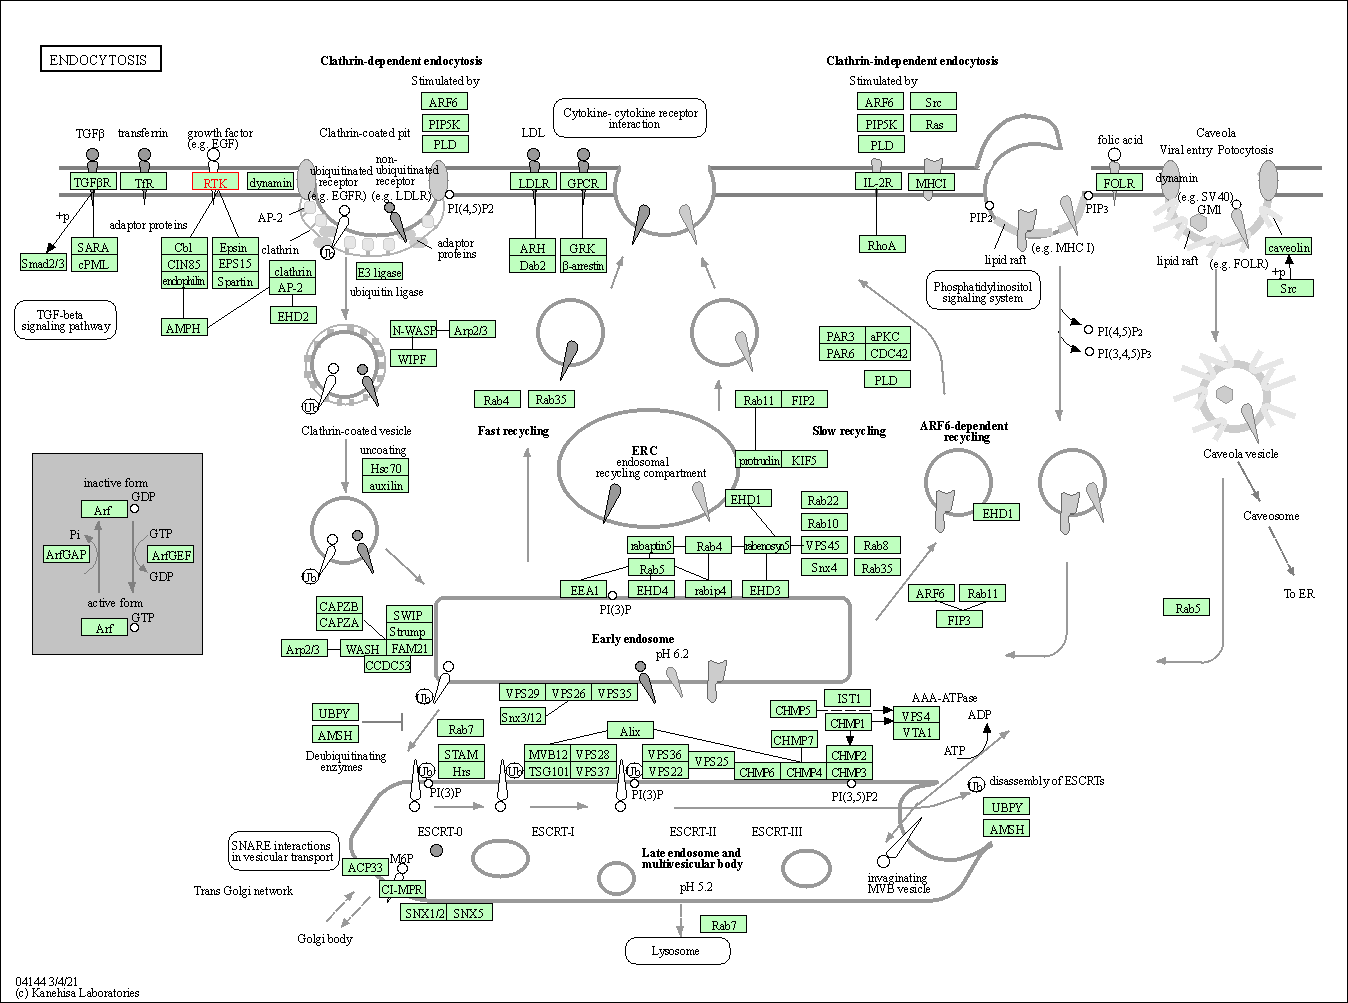


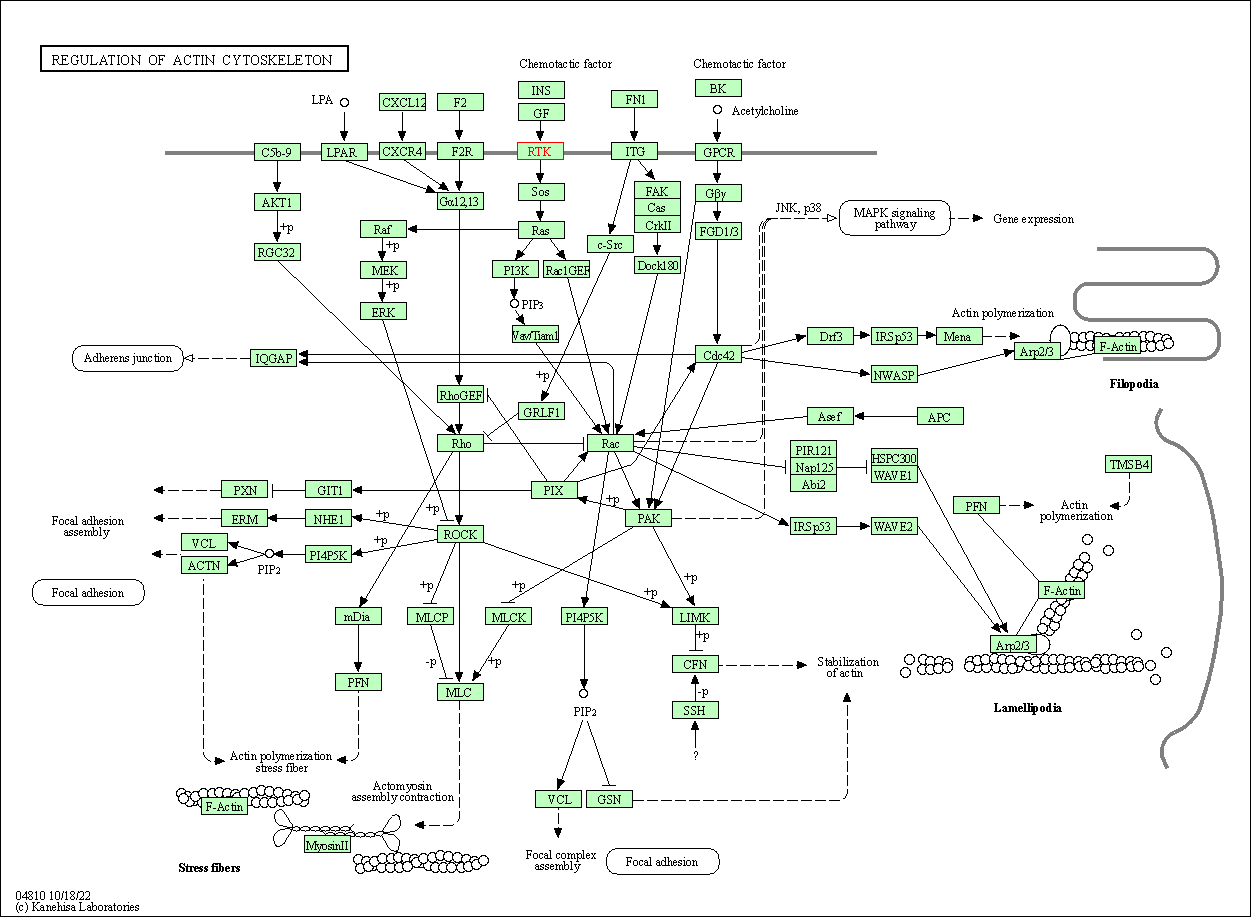
| KEGG Pathway | Pathway ID | Affiliated Target | Pathway Map |
|---|---|---|---|
| MAPK signaling pathway | hsa04010 | Affiliated Target |

|
| Class: Environmental Information Processing => Signal transduction | Pathway Hierarchy | ||
| Ras signaling pathway | hsa04014 | Affiliated Target |

|
| Class: Environmental Information Processing => Signal transduction | Pathway Hierarchy | ||
| Rap1 signaling pathway | hsa04015 | Affiliated Target |

|
| Class: Environmental Information Processing => Signal transduction | Pathway Hierarchy | ||
| Calcium signaling pathway | hsa04020 | Affiliated Target |

|
| Class: Environmental Information Processing => Signal transduction | Pathway Hierarchy | ||
| Endocytosis | hsa04144 | Affiliated Target |

|
| Class: Cellular Processes => Transport and catabolism | Pathway Hierarchy | ||
| PI3K-Akt signaling pathway | hsa04151 | Affiliated Target |

|
| Class: Environmental Information Processing => Signal transduction | Pathway Hierarchy | ||
| Signaling pathways regulating pluripotency of stem cells | hsa04550 | Affiliated Target |

|
| Class: Cellular Processes => Cellular community - eukaryotes | Pathway Hierarchy | ||
| Regulation of actin cytoskeleton | hsa04810 | Affiliated Target |

|
| Class: Cellular Processes => Cell motility | Pathway Hierarchy | ||
| Click to Show/Hide the Information of Affiliated Human Pathways | |||
| Degree | 10 | Degree centrality | 1.07E-03 | Betweenness centrality | 8.28E-05 |
|---|---|---|---|---|---|
| Closeness centrality | 2.14E-01 | Radiality | 1.38E+01 | Clustering coefficient | 2.00E-01 |
| Neighborhood connectivity | 2.91E+01 | Topological coefficient | 1.93E-01 | Eccentricity | 12 |
| Download | Click to Download the Full PPI Network of This Target | ||||
| Chemical Structure based Activity Landscape of Target | Top |
|---|---|
| Target Poor or Non Binders | Top | |||||
|---|---|---|---|---|---|---|
| Target Poor or Non Binders | ||||||
| Target Regulators | Top | |||||
|---|---|---|---|---|---|---|
| Target-interacting Proteins | ||||||
| Target Affiliated Biological Pathways | Top | |||||
|---|---|---|---|---|---|---|
| KEGG Pathway | [+] 7 KEGG Pathways | + | ||||
| 1 | MAPK signaling pathway | |||||
| 2 | Ras signaling pathway | |||||
| 3 | Rap1 signaling pathway | |||||
| 4 | Endocytosis | |||||
| 5 | PI3K-Akt signaling pathway | |||||
| 6 | Signaling pathways regulating pluripotency of stem cells | |||||
| 7 | Regulation of actin cytoskeleton | |||||
| Panther Pathway | [+] 1 Panther Pathways | + | ||||
| 1 | FGF signaling pathway | |||||
| PID Pathway | [+] 1 PID Pathways | + | ||||
| 1 | FGF signaling pathway | |||||
| Reactome | [+] 10 Reactome Pathways | + | ||||
| 1 | PI3K Cascade | |||||
| 2 | PIP3 activates AKT signaling | |||||
| 3 | FGFR4 ligand binding and activation | |||||
| 4 | Constitutive Signaling by Aberrant PI3K in Cancer | |||||
| 5 | Phospholipase C-mediated cascade | |||||
| 6 | FRS-mediated FGFR4 signaling | |||||
| 7 | SHC-mediated cascade:FGFR4 | |||||
| 8 | PI-3K cascade:FGFR4 | |||||
| 9 | Negative regulation of FGFR4 signaling | |||||
| 10 | RAF/MAP kinase cascade | |||||
| WikiPathways | [+] 4 WikiPathways | + | ||||
| 1 | Regulation of Actin Cytoskeleton | |||||
| 2 | Signaling by Type 1 Insulin-like Growth Factor 1 Receptor (IGF1R) | |||||
| 3 | PIP3 activates AKT signaling | |||||
| 4 | Signaling by FGFR | |||||
| References | Top | |||||
|---|---|---|---|---|---|---|
| REF 1 | URL: http://www.guidetopharmacology.org Nucleic Acids Res. 2015 Oct 12. pii: gkv1037. The IUPHAR/BPS Guide to PHARMACOLOGY in 2016: towards curated quantitative interactions between 1300 protein targets and 6000 ligands. (Target id: 1811). | |||||
| REF 2 | Clinical pipeline report, company report or official report of the Pharmaceutical Research and Manufacturers of America (PhRMA) | |||||
| REF 3 | Structural insights into FGFR kinase isoform selectivity: diverse binding modes of AZD4547 and ponatinib in complex with FGFR1 and FGFR4. Structure. 2014 Dec 2;22(12):1764-1774. | |||||
| REF 4 | Structural analysis of the human fibroblast growth factor receptor 4 kinase. J Mol Biol. 2014 Nov 11;426(22):3744-3756. | |||||
If You Find Any Error in Data or Bug in Web Service, Please Kindly Report It to Dr. Zhou and Dr. Zhang.

