Target Information
| Target General Information | Top | |||||
|---|---|---|---|---|---|---|
| Target ID |
T80454
(Former ID: TTDI00126)
|
|||||
| Target Name |
T-lymphoma invasion and metastasis 1 (TIAM1)
|
|||||
| Synonyms |
TIAM-1; T-lymphoma invasion and metastasis-inducing protein 1
Click to Show/Hide
|
|||||
| Gene Name |
TIAM1
|
|||||
| Target Type |
Literature-reported target
|
[1] | ||||
| Function |
Acts as a GDP-dissociation stimulator protein that stimulates the GDP-GTP exchange activity of RHO-like GTPases and activates them. Activates RAC1, CDC42, and to a lesser extent RHOA. Required for normal cell adhesion and cell migration. Modulates the activity of RHO-like proteins and connects extracellular signals to cytoskeletal activities.
Click to Show/Hide
|
|||||
| UniProt ID | ||||||
| Sequence |
MGNAESQHVEHEFYGEKHASLGRKHTSRSLRLSHKTRRTRHASSGKVIHRNSEVSTRSSS
TPSIPQSLAENGLEPFSQDGTLEDFGSPIWVDRVDMGLRPVSYTDSSVTPSVDSSIVLTA ASVQSMPDTEESRLYGDDATYLAEGGRRQHSYTSNGPTFMETASFKKKRSKSADIWREDS LEFSLSDLSQEHLTSNEEILGSAEEKDCEEARGMETRASPRQLSTCQRANSLGDLYAQKN SGVTANGGPGSKFAGYCRNLVSDIPNLANHKMPPAAAEETPPYSNYNTLPCRKSHCLSEG ATNPQISHSNSMQGRRAKTTQDVNAGEGSEFADSGIEGATTDTDLLSRRSNATNSSYSPT TGRAFVGSDSGSSSTGDAARQGVYENFRRELEMSTTNSESLEEAGSAHSDEQSSGTLSSP GQSDILLTAAQGTVRKAGALAVKNFLVHKKNKKVESATRRKWKHYWVSLKGCTLFFYESD GRSGIDHNSIPKHAVWVENSIVQAVPEHPKKDFVFCLSNSLGDAFLFQTTSQTELENWIT AIHSACATAVARHHHKEDTLRLLKSEIKKLEQKIDMDEKMKKMGEMQLSSVTDSKKKKTI LDQIFVWEQNLEQFQMDLFRFRCYLASLQGGELPNPKRLLAFASRPTKVAMGRLGIFSVS SFHALVAARTGETGVRRRTQAMSRSASKRRSRFSSLWGLDTTSKKKQGRPSINQVFGEGT EAVKKSLEGIFDDIVPDGKREKEVVLPNVHQHNPDCDIWVHEYFTPSWFCLPNNQPALTV VRPGDTARDTLELICKTHQLDHSAHYLRLKFLIENKMQLYVPQPEEDIYELLYKEIEICP KVTQSIHIEKSDTAADTYGFSLSSVEEDGIRRLYVNSVKETGLASKKGLKAGDEILEINN RAADALNSSMLKDFLSQPSLGLLVRTYPELEEGVELLESPPHRVDGPADLGESPLAFLTS NPGHSLCSEQGSSAETAPEETEGPDLESSDETDHSSKSTEQVAAFCRSLHEMNPSDQSPS PQDSTGPQLATMRQLSDADKLRKVICELLETERTYVKDLNCLMERYLKPLQKETFLTQDE LDVLFGNLTEMVEFQVEFLKTLEDGVRLVPDLEKLEKVDQFKKVLFSLGGSFLYYADRFK LYSAFCASHTKVPKVLVKAKTDTAFKAFLDAQNPKQQHSSTLESYLIKPIQRILKYPLLL RELFALTDAESEEHYHLDVAIKTMNKVASHINEMQKIHEEFGAVFDQLIAEQTGEKKEVA DLSMGDLLLHTTVIWLNPPASLGKWKKEPELAAFVFKTAVVLVYKDGSKQKKKLVGSHRL SIYEDWDPFRFRHMIPTEALQVRALASADAEANAVCEIVHVKSESEGRPERVFHLCCSSP ESRKDFLKAVHSILRDKHRRQLLKTESLPSSQQYVPFGGKRLCALKGARPAMSRAVSAPS KSLGRRRRRLARNRFTIDSDAVSASSPEKESQQPPGGGDTDRWVEEQFDLAQYEEQDDIK ETDILSDDDEFCESVKGASVDRDLQERLQATSISQRERGRKTLDSHASRMAQLKKQAALS GINGGLESASEEVIWVRREDFAPSRKLNTEI Click to Show/Hide
|
|||||
| 3D Structure | Click to Show 3D Structure of This Target | AlphaFold | ||||
| Cell-based Target Expression Variations | Top | |||||
|---|---|---|---|---|---|---|
| Cell-based Target Expression Variations | ||||||
| Drug Binding Sites of Target | Top | |||||
|---|---|---|---|---|---|---|
| Ligand Name: Phosphonotyrosine | Ligand Info | |||||
| Structure Description | Crystal Structure of T-cell Lymphoma Invasion and Metastasis-1 PDZ in complex with phosphorylated Syndecan1 Peptide | PDB:4GVC | ||||
| Method | X-ray diffraction | Resolution | 1.54 Å | Mutation | No | [2] |
| PDB Sequence |
GAMGKVTHSI
846 HIEKSDTAAD856 TYGFSLSSVE866 EDGIRRLYVN876 SVKETGLASK886 KGLKAGDEIL 896 EINNRAADAL906 NSSMLKDFLS916 QPSLGLLVRT926 YPEL
|
|||||
|
|
||||||
| Ligand Name: 5-(Dimethylamino)naphthalene-1-sulfonic acid | Ligand Info | |||||
| Structure Description | Crystal Structure of T-cell Lymphoma Invasion and Metastasis-1 PDZ in complex with phosphorylated Syndecan1 Peptide | PDB:4GVC | ||||
| Method | X-ray diffraction | Resolution | 1.54 Å | Mutation | No | [2] |
| PDB Sequence |
GAMGKVTHSI
846 HIEKSDTAAD856 TYGFSLSSVE866 EDGIRRLYVN876 SVKETGLASK886 KGLKAGDEIL 896 EINNRAADAL906 NSSMLKDFLS916 QPSLGLLVRT926 YPEL
|
|||||
|
|
||||||
| Click to View More Binding Site Information of This Target and Ligand Pair | ||||||
| Click to View More Binding Site Information of This Target with Different Ligands | ||||||
| Different Human System Profiles of Target | Top |
|---|---|
|
Human Similarity Proteins
of target is determined by comparing the sequence similarity of all human proteins with the target based on BLAST. The similarity proteins for a target are defined as the proteins with E-value < 0.005 and outside the protein families of the target.
A target that has fewer human similarity proteins outside its family is commonly regarded to possess a greater capacity to avoid undesired interactions and thus increase the possibility of finding successful drugs
(Brief Bioinform, 21: 649-662, 2020).
Human Tissue Distribution
of target is determined from a proteomics study that quantified more than 12,000 genes across 32 normal human tissues. Tissue Specificity (TS) score was used to define the enrichment of target across tissues.
The distribution of targets among different tissues or organs need to be taken into consideration when assessing the target druggability, as it is generally accepted that the wider the target distribution, the greater the concern over potential adverse effects
(Nat Rev Drug Discov, 20: 64-81, 2021).
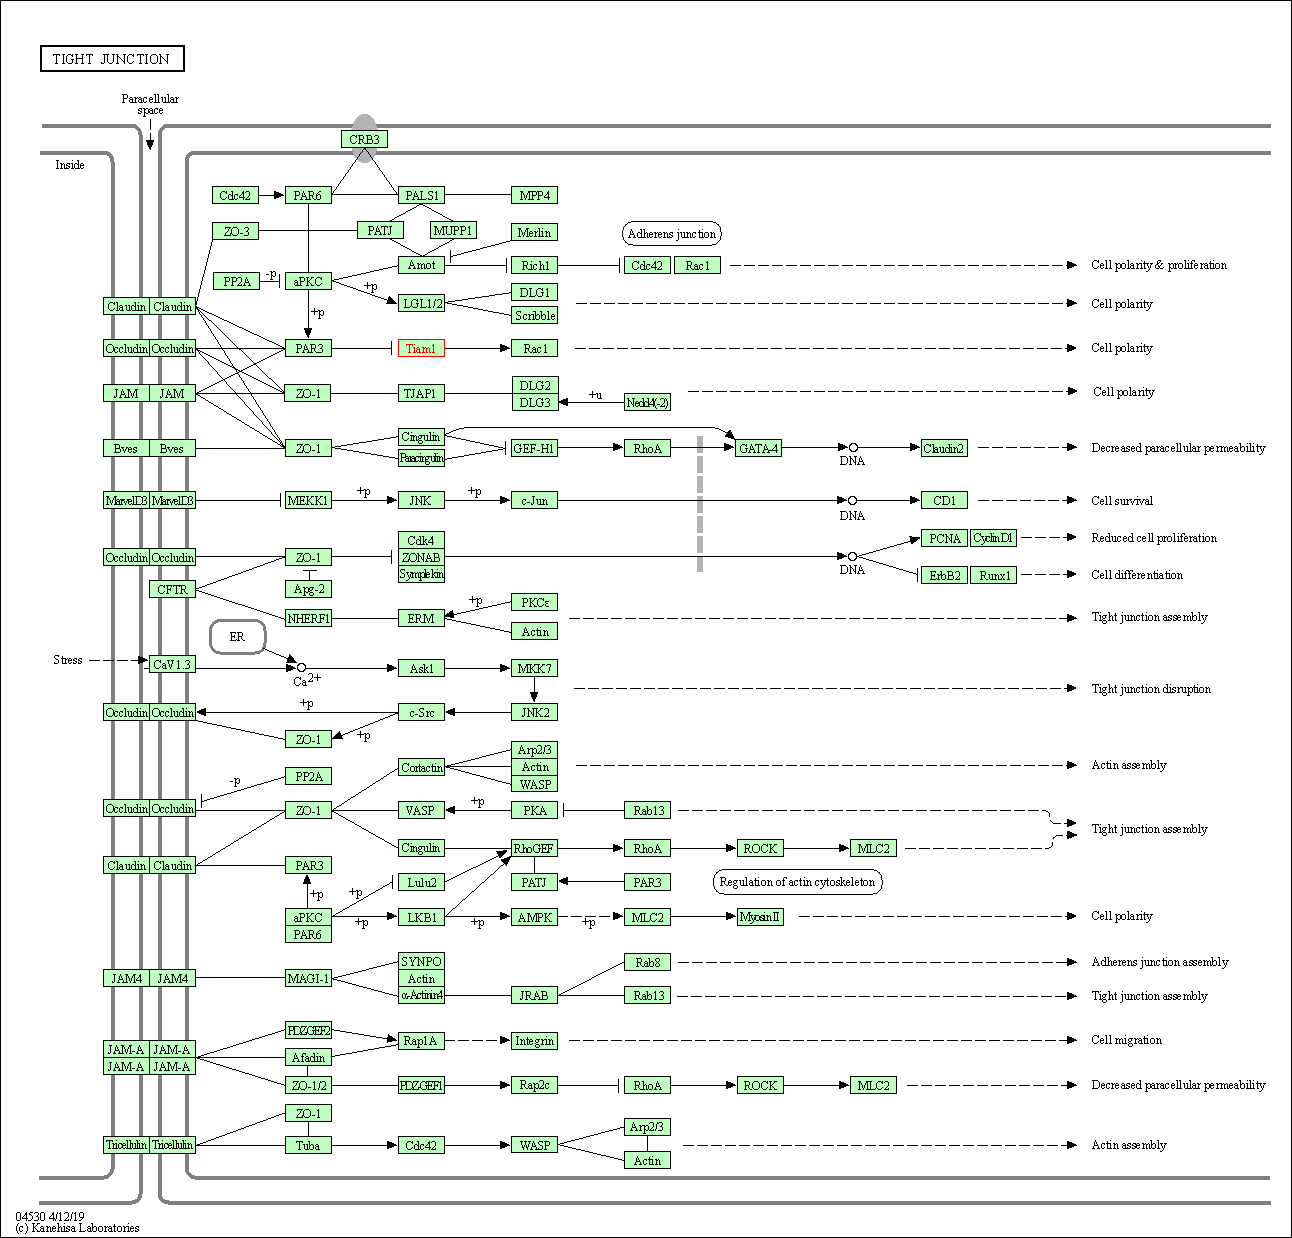
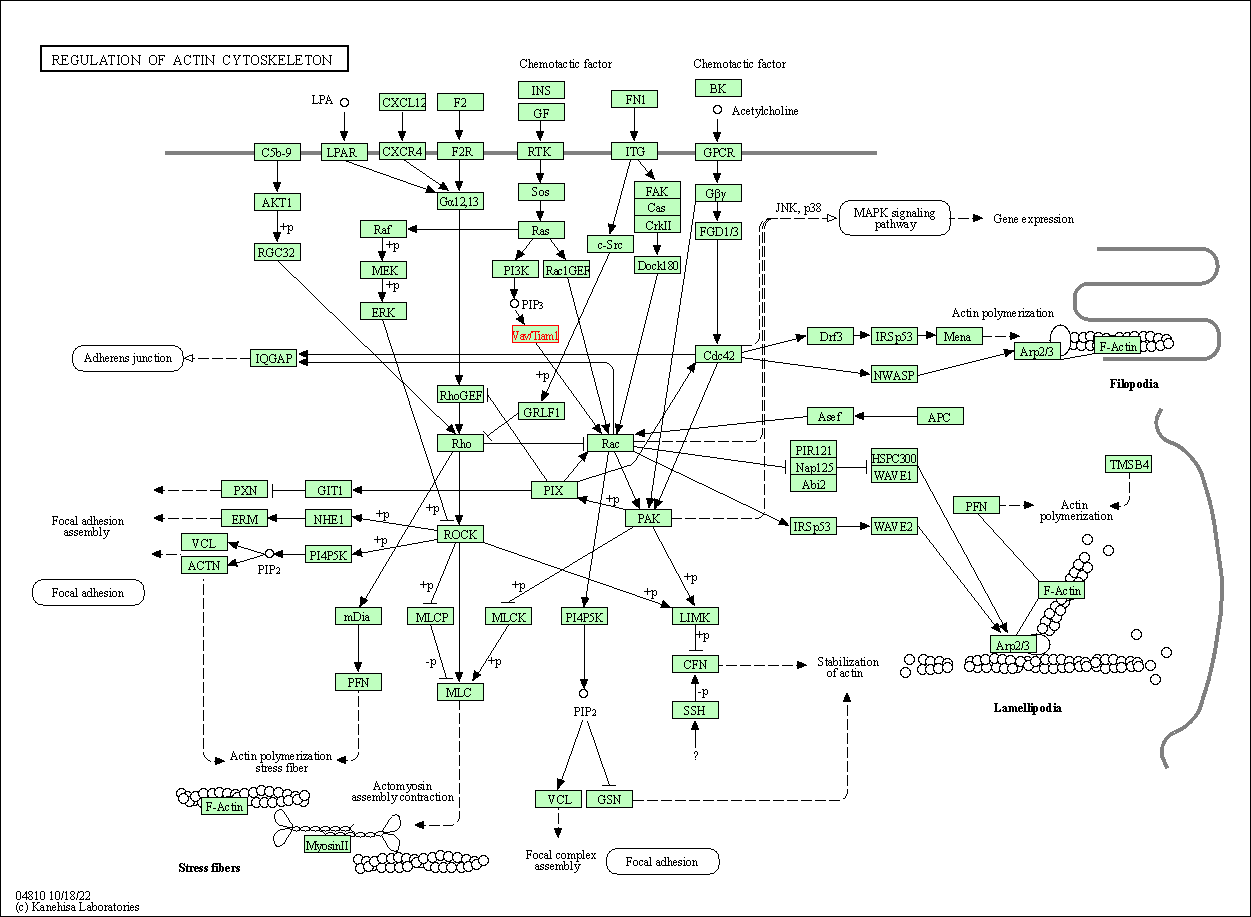
Human Pathway Affiliation
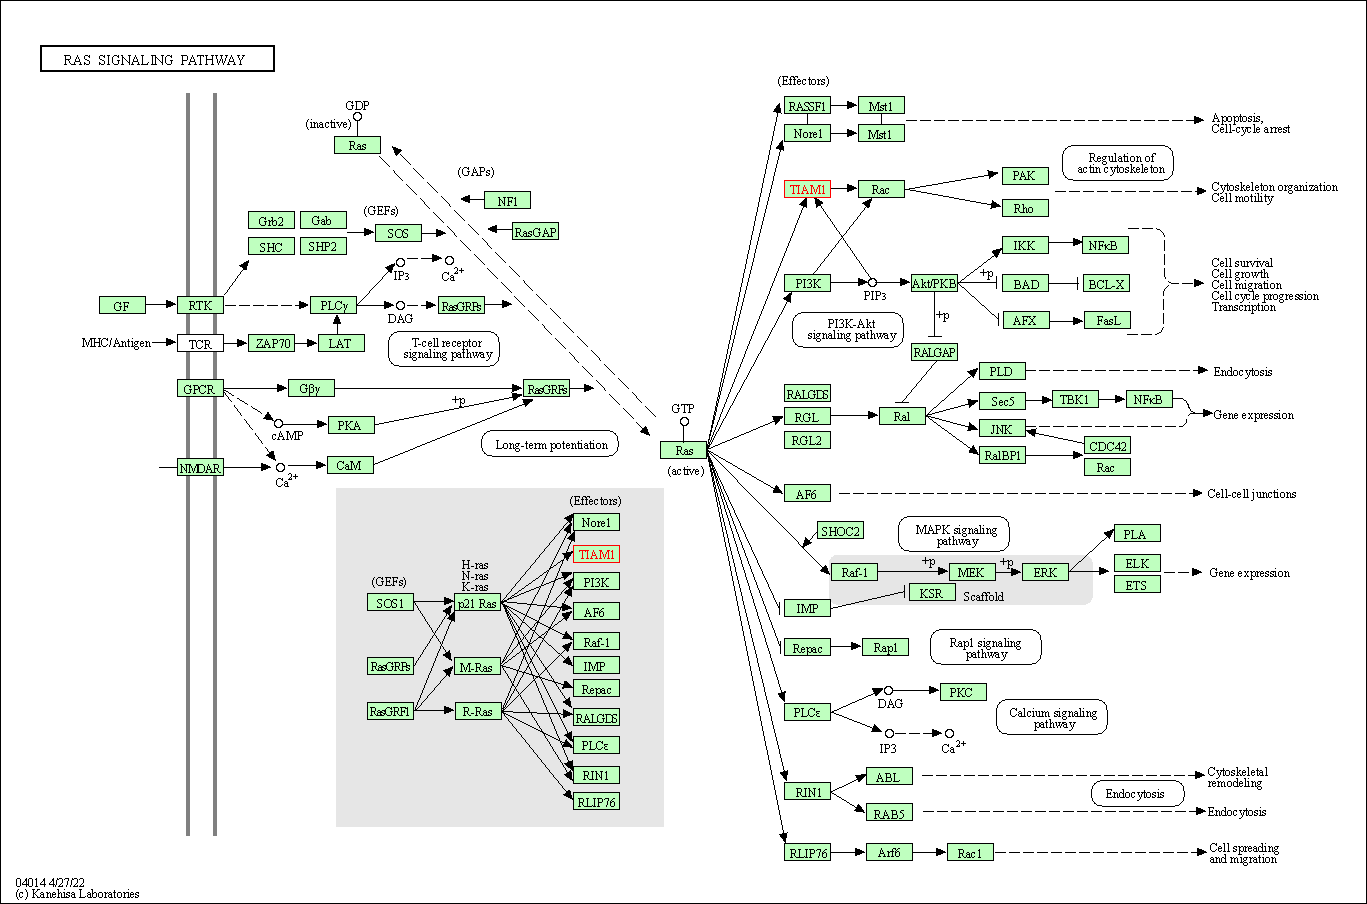
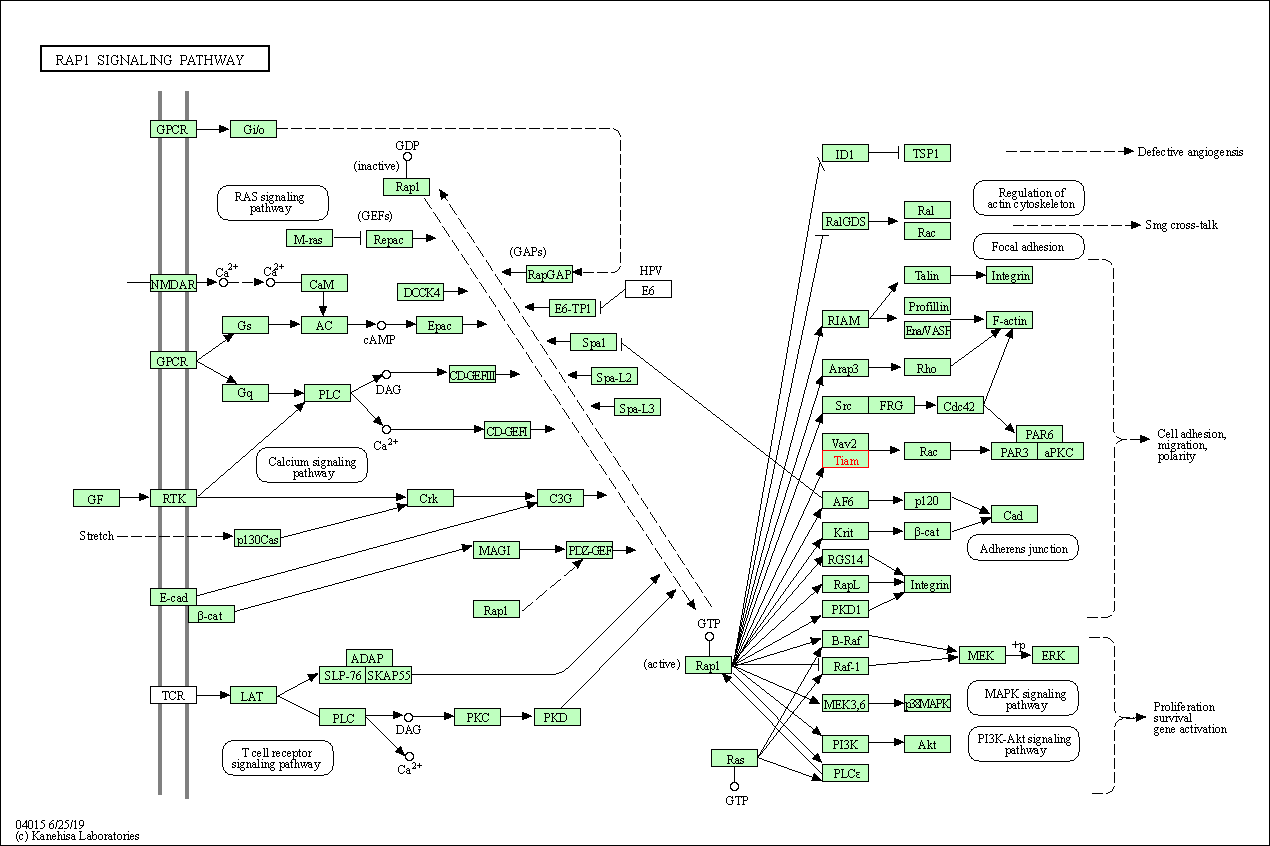
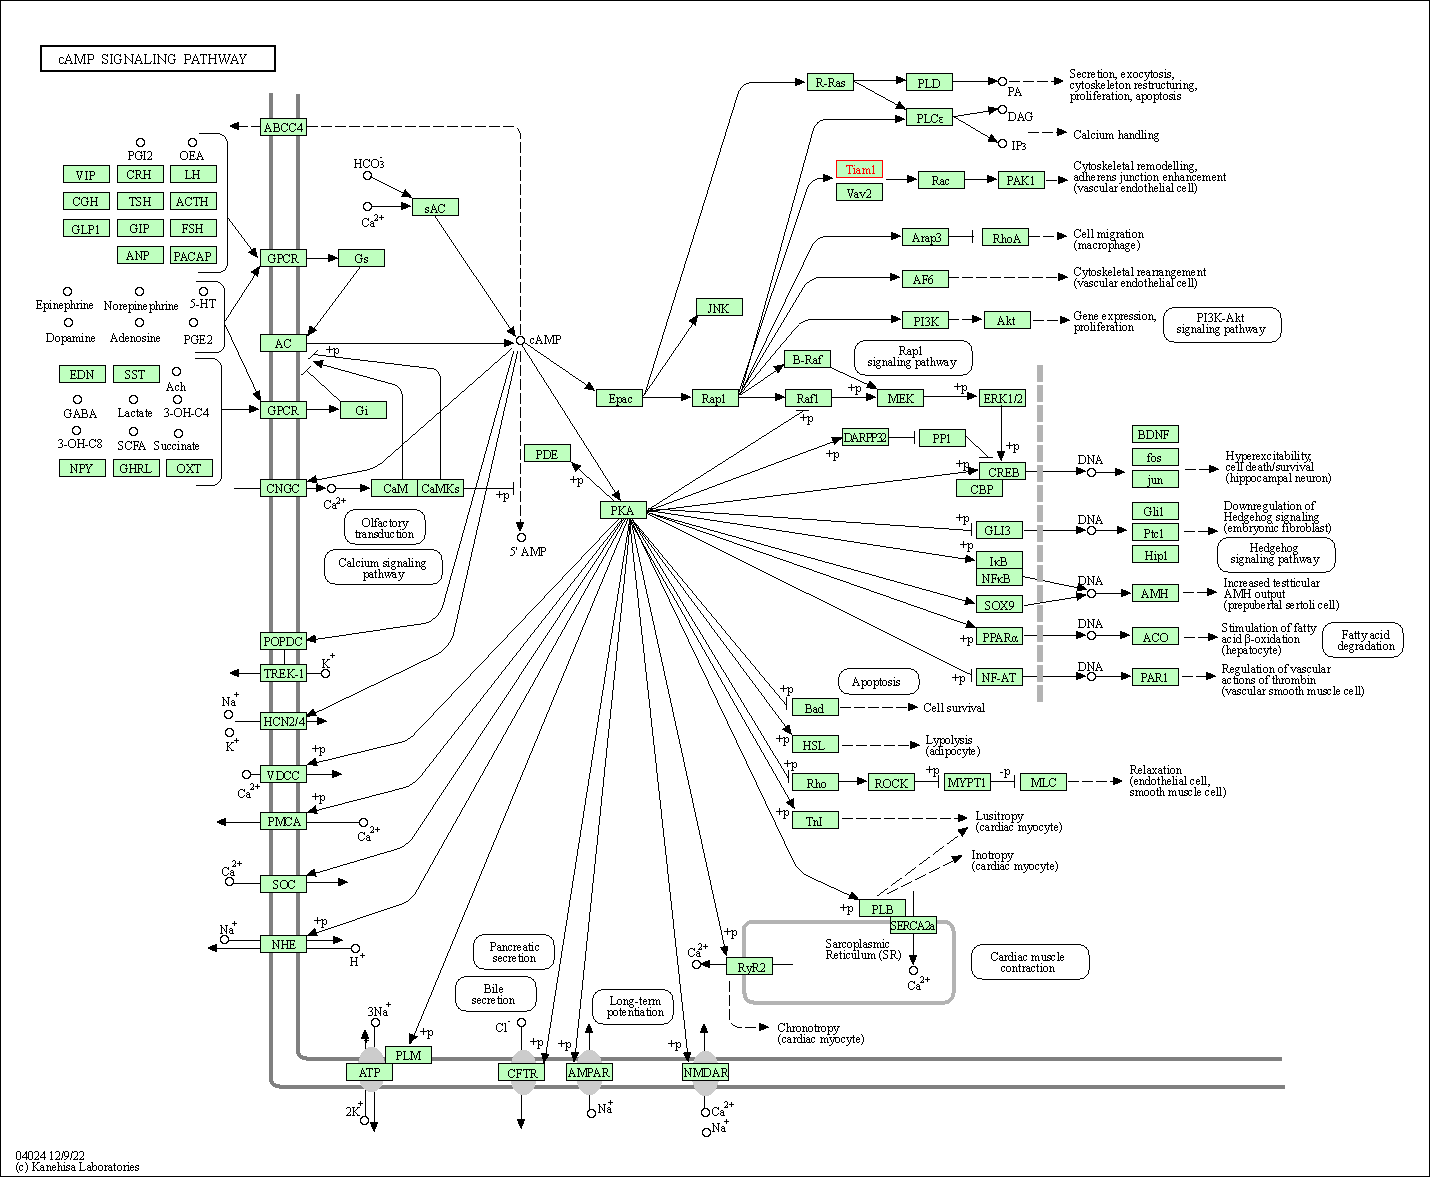
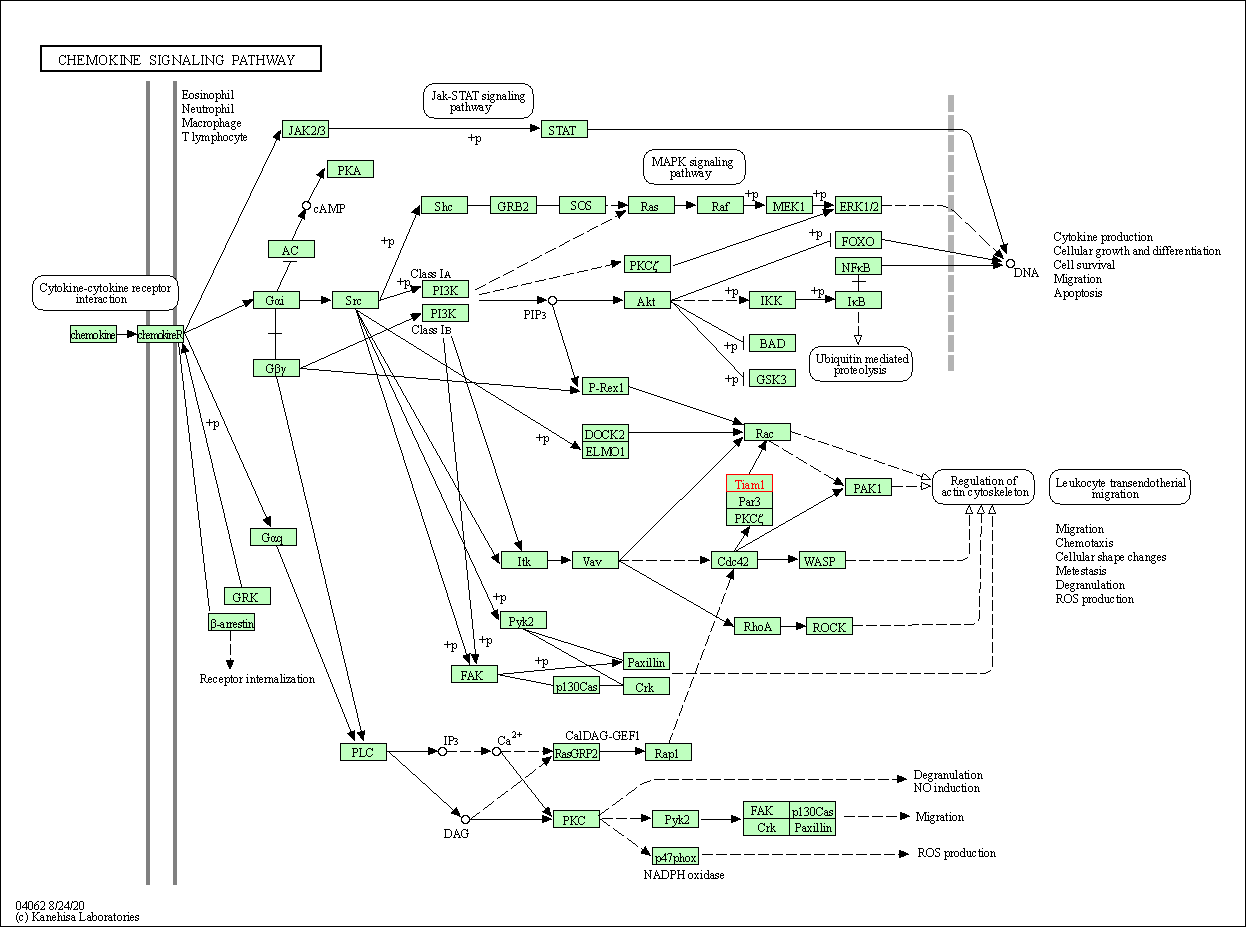
of target is determined by the life-essential pathways provided on KEGG database. The target-affiliated pathways were defined based on the following two criteria (a) the pathways of the studied target should be life-essential for both healthy individuals and patients, and (b) the studied target should occupy an upstream position in the pathways and therefore had the ability to regulate biological function.
Targets involved in a fewer pathways have greater likelihood to be successfully developed, while those associated with more human pathways increase the chance of undesirable interferences with other human processes
(Pharmacol Rev, 58: 259-279, 2006).
Biological Network Descriptors
of target is determined based on a human protein-protein interactions (PPI) network consisting of 9,309 proteins and 52,713 PPIs, which were with a high confidence score of ≥ 0.95 collected from STRING database.
The network properties of targets based on protein-protein interactions (PPIs) have been widely adopted for the assessment of target’s druggability. Proteins with high node degree tend to have a high impact on network function through multiple interactions, while proteins with high betweenness centrality are regarded to be central for communication in interaction networks and regulate the flow of signaling information
(Front Pharmacol, 9, 1245, 2018;
Curr Opin Struct Biol. 44:134-142, 2017).
Human Similarity Proteins
Human Tissue Distribution
Human Pathway Affiliation
Biological Network Descriptors
|
|
|
Note:
If a protein has TS (tissue specficity) scores at least in one tissue >= 2.5, this protein is called tissue-enriched (including tissue-enriched-but-not-specific and tissue-specific). In the plots, the vertical lines are at thresholds 2.5 and 4.
|
| KEGG Pathway | Pathway ID | Affiliated Target | Pathway Map |
|---|---|---|---|
| Ras signaling pathway | hsa04014 | Affiliated Target |
|
| Class: Environmental Information Processing => Signal transduction | Pathway Hierarchy | ||
| Rap1 signaling pathway | hsa04015 | Affiliated Target |
|
| Class: Environmental Information Processing => Signal transduction | Pathway Hierarchy | ||
| cAMP signaling pathway | hsa04024 | Affiliated Target |
|
| Class: Environmental Information Processing => Signal transduction | Pathway Hierarchy | ||
| Chemokine signaling pathway | hsa04062 | Affiliated Target |
|
| Class: Organismal Systems => Immune system | Pathway Hierarchy | ||
| Tight junction | hsa04530 | Affiliated Target |
|
| Class: Cellular Processes => Cellular community - eukaryotes | Pathway Hierarchy | ||
| Regulation of actin cytoskeleton | hsa04810 | Affiliated Target |
|
| Class: Cellular Processes => Cell motility | Pathway Hierarchy | ||
| Click to Show/Hide the Information of Affiliated Human Pathways | |||
| Degree | 18 | Degree centrality | 1.93E-03 | Betweenness centrality | 5.71E-04 |
|---|---|---|---|---|---|
| Closeness centrality | 2.47E-01 | Radiality | 1.43E+01 | Clustering coefficient | 1.76E-01 |
| Neighborhood connectivity | 6.06E+01 | Topological coefficient | 9.55E-02 | Eccentricity | 12 |
| Download | Click to Download the Full PPI Network of This Target | ||||
| Target Regulators | Top | |||||
|---|---|---|---|---|---|---|
| Target-regulating microRNAs | ||||||
| Target-interacting Proteins | ||||||
| References | Top | |||||
|---|---|---|---|---|---|---|
| REF 1 | The prognostic value of T Lymphoma Invasion and Metastasis 1 (TIAM1) expression in oral squamous cell carcinoma. J Biochem Mol Toxicol. 2017 Apr;31(4). | |||||
| REF 2 | The structure of the Tiam1 PDZ domain/ phospho-syndecan1 complex reveals a ligand conformation that modulates protein dynamics. Structure. 2013 Mar 5;21(3):342-54. | |||||
If You Find Any Error in Data or Bug in Web Service, Please Kindly Report It to Dr. Zhou and Dr. Zhang.

