Target Information
| Target General Information | Top | |||||
|---|---|---|---|---|---|---|
| Target ID |
T53251
(Former ID: TTDI03186)
|
|||||
| Target Name |
Histone-lysine N-methyltransferase EHMT2 (EHMT2)
|
|||||
| Synonyms |
Protein G9a; NG36; Lysine N-methyltransferase 1C; KMT1C; Histone H3-K9 methyltransferase 3; HLA-B-associated transcript 8; H3-K9-HMTase 3; G9A; Euchromatic histone-lysine N-methyltransferase 2; C6orf30; BAT8
Click to Show/Hide
|
|||||
| Gene Name |
EHMT2
|
|||||
| Target Type |
Preclinical target
|
[1] | ||||
| Disease | [+] 3 Target-related Diseases | + | ||||
| 1 | Breast cancer [ICD-11: 2C60-2C6Y] | |||||
| 2 | Postoperative inflammation [ICD-11: 1A00-CA43] | |||||
| 3 | Solid tumour/cancer [ICD-11: 2A00-2F9Z] | |||||
| Function |
H3K9me represents a specific tag for epigenetic transcriptional repression by recruiting HP1 proteins to methylated histones. Also mediates monomethylation of 'Lys-56' of histone H3 (H3K56me1) in G1 phase, leading to promote interaction between histone H3 and PCNA and regulating DNA replication. Also weakly methylates 'Lys-27' of histone H3 (H3K27me). Also required for DNA methylation, the histone methyltransferase activity is not required for DNA methylation, suggesting that these 2 activities function independently. Probably targeted to histone H3 by different DNA-binding proteins like E2F6, MGA, MAX and/or DP1. May also methylate histone H1. In addition to the histone methyltransferase activity, also methylates non-histone proteins: mediates dimethylation of 'Lys-373' of p53/TP53. Also methylates CDYL, WIZ, ACIN1, DNMT1, HDAC1, ERCC6, KLF12 and itself. Histone methyltransferase that specifically mono- and dimethylates 'Lys-9' of histone H3 (H3K9me1 and H3K9me2, respectively) in euchromatin.
Click to Show/Hide
|
|||||
| BioChemical Class |
Methyltransferase
|
|||||
| UniProt ID | ||||||
| EC Number |
EC 2.1.1.-
|
|||||
| Sequence |
MAAAAGAAAAAAAEGEAPAEMGALLLEKETRGATERVHGSLGDTPRSEETLPKATPDSLE
PAGPSSPASVTVTVGDEGADTPVGATPLIGDESENLEGDGDLRGGRILLGHATKSFPSSP SKGGSCPSRAKMSMTGAGKSPPSVQSLAMRLLSMPGAQGAAAAGSEPPPATTSPEGQPKV HRARKTMSKPGNGQPPVPEKRPPEIQHFRMSDDVHSLGKVTSDLAKRRKLNSGGGLSEEL GSARRSGEVTLTKGDPGSLEEWETVVGDDFSLYYDSYSVDERVDSDSKSEVEALTEQLSE EEEEEEEEEEEEEEEEEEEEEEEDEESGNQSDRSGSSGRRKAKKKWRKDSPWVKPSRKRR KREPPRAKEPRGVNGVGSSGPSEYMEVPLGSLELPSEGTLSPNHAGVSNDTSSLETERGF EELPLCSCRMEAPKIDRISERAGHKCMATESVDGELSGCNAAILKRETMRPSSRVALMVL CETHRARMVKHHCCPGCGYFCTAGTFLECHPDFRVAHRFHKACVSQLNGMVFCPHCGEDA SEAQEVTIPRGDGVTPPAGTAAPAPPPLSQDVPGRADTSQPSARMRGHGEPRRPPCDPLA DTIDSSGPSLTLPNGGCLSAVGLPLGPGREALEKALVIQESERRKKLRFHPRQLYLSVKQ GELQKVILMLLDNLDPNFQSDQQSKRTPLHAAAQKGSVEICHVLLQAGANINAVDKQQRT PLMEAVVNNHLEVARYMVQRGGCVYSKEEDGSTCLHHAAKIGNLEMVSLLLSTGQVDVNA QDSGGWTPIIWAAEHKHIEVIRMLLTRGADVTLTDNEENICLHWASFTGSAAIAEVLLNA RCDLHAVNYHGDTPLHIAARESYHDCVLLFLSRGANPELRNKEGDTAWDLTPERSDVWFA LQLNRKLRLGVGNRAIRTEKIICRDVARGYENVPIPCVNGVDGEPCPEDYKYISENCETS TMNIDRNITHLQHCTCVDDCSSSNCLCGQLSIRCWYDKDGRLLQEFNKIEPPLIFECNQA CSCWRNCKNRVVQSGIKVRLQLYRTAKMGWGVRALQTIPQGTFICEYVGELISDAEADVR EDDSYLFDLDNKDGEVYCIDARYYGNISRFINHLCDPNIIPVRVFMLHQDLRFPRIAFFS SRDIRTGEELGFDYGDRFWDIKSKYFTCQCGSEKCKHSAEAIALEQSRLARLDPHPELLP ELGSLPPVNT Click to Show/Hide
|
|||||
| 3D Structure | Click to Show 3D Structure of This Target | AlphaFold | ||||
| HIT2.0 ID | T36I66 | |||||
| Drugs and Modes of Action | Top | |||||
|---|---|---|---|---|---|---|
| Preclinical Drug(s) | [+] 3 Preclinical Drugs | + | ||||
| 1 | A-366 | Drug Info | Preclinical | Solid tumour/cancer | [2] | |
| 2 | BIX-01294 | Drug Info | Preclinical | Breast cancer | [2] | |
| 3 | MS012 | Drug Info | Preclinical | Inflammation | [2] | |
| Mode of Action | [+] 1 Modes of Action | + | ||||
| Inhibitor | [+] 7 Inhibitor drugs | + | ||||
| 1 | A-366 | Drug Info | [3] | |||
| 2 | BIX-01294 | Drug Info | [4] | |||
| 3 | MS012 | Drug Info | [2] | |||
| 4 | BRD9539 | Drug Info | [5] | |||
| 5 | UNC0321 | Drug Info | [1] | |||
| 6 | UNC0638 | Drug Info | [6] | |||
| 7 | UNC0642 | Drug Info | [7] | |||
| Cell-based Target Expression Variations | Top | |||||
|---|---|---|---|---|---|---|
| Cell-based Target Expression Variations | ||||||
| Drug Binding Sites of Target | Top | |||||
|---|---|---|---|---|---|---|
| Ligand Name: Ademetionine | Ligand Info | |||||
| Structure Description | Structure of human G9a SET-domain (EHMT2) in complex with inhibitor 13 | PDB:5VSC | ||||
| Method | X-ray diffraction | Resolution | 1.40 Å | Mutation | No | [8] |
| PDB Sequence |
TEKIICRDVA
927 RGYENVPIPC937 VNGVDGEPCP947 EDYKYISENC957 ETSTMNIDRN967 ITHLQHCTCV 977 DDCSSSNCLC987 GQLSIRCWYD997 KDGRLLQEFN1007 KIEPPLIFEC1017 NQACSCWRNC 1027 KNRVVQSGIK1037 VRLQLYRTAK1047 MGWGVRALQT1057 IPQGTFICEY1067 VGELISDAEA 1077 DVREDDSYLF1087 DLDEVYCIDA1101 RYYGNISRFI1111 NHLCDPNIIP1121 VRVFMLHQDL 1131 RFPRIAFFSS1141 RDIRTGEELG1151 FDYGDRFWDI1161 KSKYFTCQCG1171 SEKCKHSAEA 1181 IALEQSRLA
|
|||||
|
|
ARG1044
4.530
MET1048
2.659
GLY1049
3.727
TRP1050
2.826
SER1084
3.356
TYR1085
2.791
ARG1109
3.063
PHE1110
3.639
ILE1111
3.780
ASN1112
2.878
HIS1113
2.915
|
|||||
| Click to View More Binding Site Information of This Target and Ligand Pair | ||||||
| Ligand Name: Norleucine | Ligand Info | |||||
| Structure Description | Structure of G9a SET-domain with Histone H3K9norLeucine mutant peptide and bound S-adenosylmethionine | PDB:5JIY | ||||
| Method | X-ray diffraction | Resolution | 1.48 Å | Mutation | No | [9] |
| PDB Sequence |
IRTEKIICRD
925 VARGYENVPI935 PCVNGVDGEP945 CPEDYKYISE955 NCETSTMNID965 RNITHLQHCT 975 CVDDCSSSNC985 LCGQLSIRCW995 YDKDGRLLQE1005 FNKIEPPLIF1015 ECNQACSCWR 1025 NCKNRVVQSG1035 IKVRLQLYRT1045 AKMGWGVRAL1055 QTIPQGTFIC1065 EYVGELISDA 1075 EADVREDDSY1085 LFDLDNKDGE1095 VYCIDARYYG1105 NISRFINHLC1115 DPNIIPVRVF 1125 MLHQDLRFPR1135 IAFFSSRDIR1145 TGEELGFDYG1155 DRFWDIKSKY1165 FTCQCGSEKC 1175 KHSAEAIALE1185 QSR
|
|||||
|
|
||||||
| Click to View More Binding Site Information of This Target and Ligand Pair | ||||||
| Click to View More Binding Site Information of This Target with Different Ligands | ||||||
| Different Human System Profiles of Target | Top |
|---|---|
|
Human Similarity Proteins
of target is determined by comparing the sequence similarity of all human proteins with the target based on BLAST. The similarity proteins for a target are defined as the proteins with E-value < 0.005 and outside the protein families of the target.
A target that has fewer human similarity proteins outside its family is commonly regarded to possess a greater capacity to avoid undesired interactions and thus increase the possibility of finding successful drugs
(Brief Bioinform, 21: 649-662, 2020).
Human Tissue Distribution
of target is determined from a proteomics study that quantified more than 12,000 genes across 32 normal human tissues. Tissue Specificity (TS) score was used to define the enrichment of target across tissues.
The distribution of targets among different tissues or organs need to be taken into consideration when assessing the target druggability, as it is generally accepted that the wider the target distribution, the greater the concern over potential adverse effects
(Nat Rev Drug Discov, 20: 64-81, 2021).
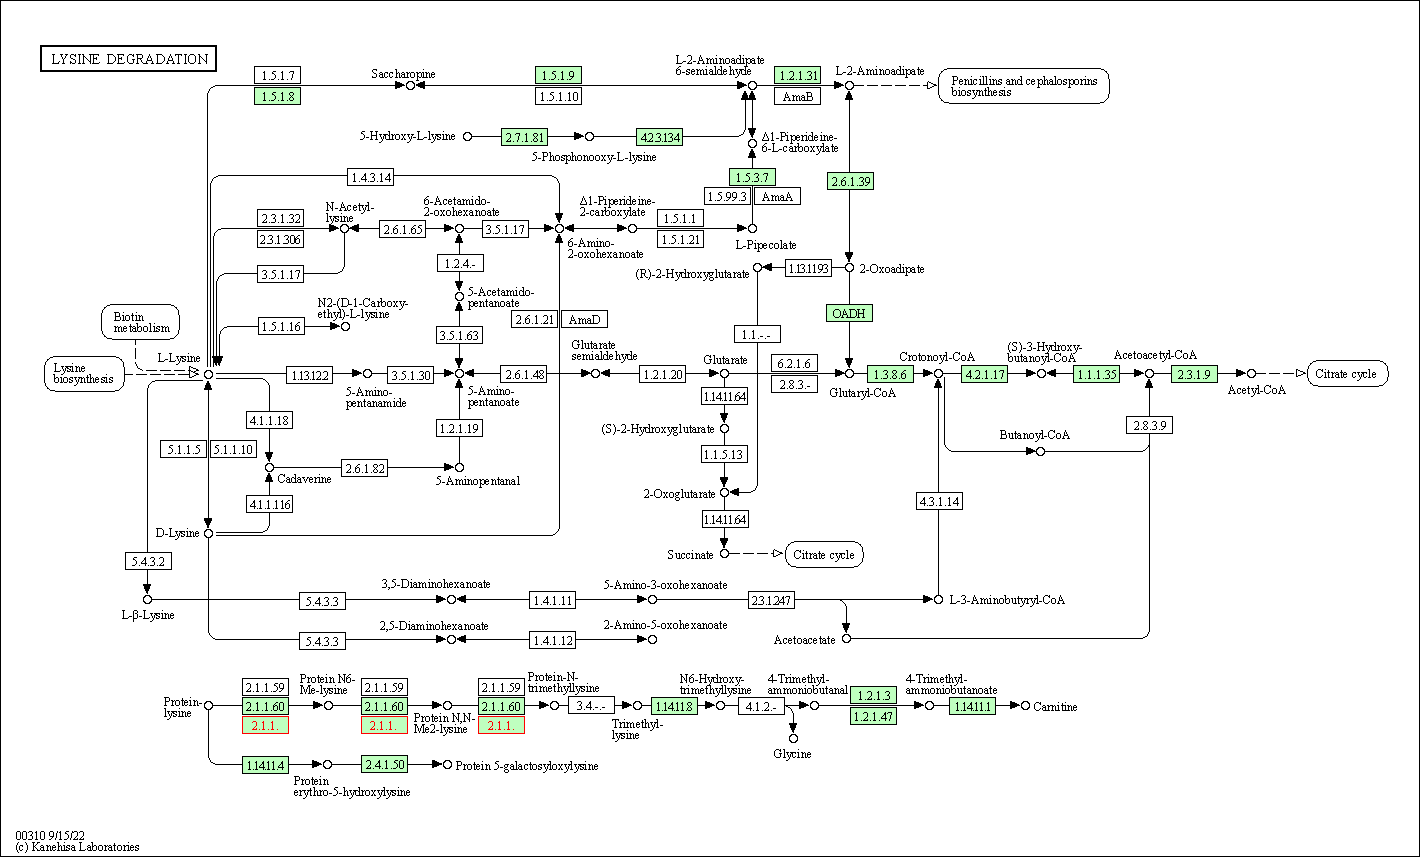
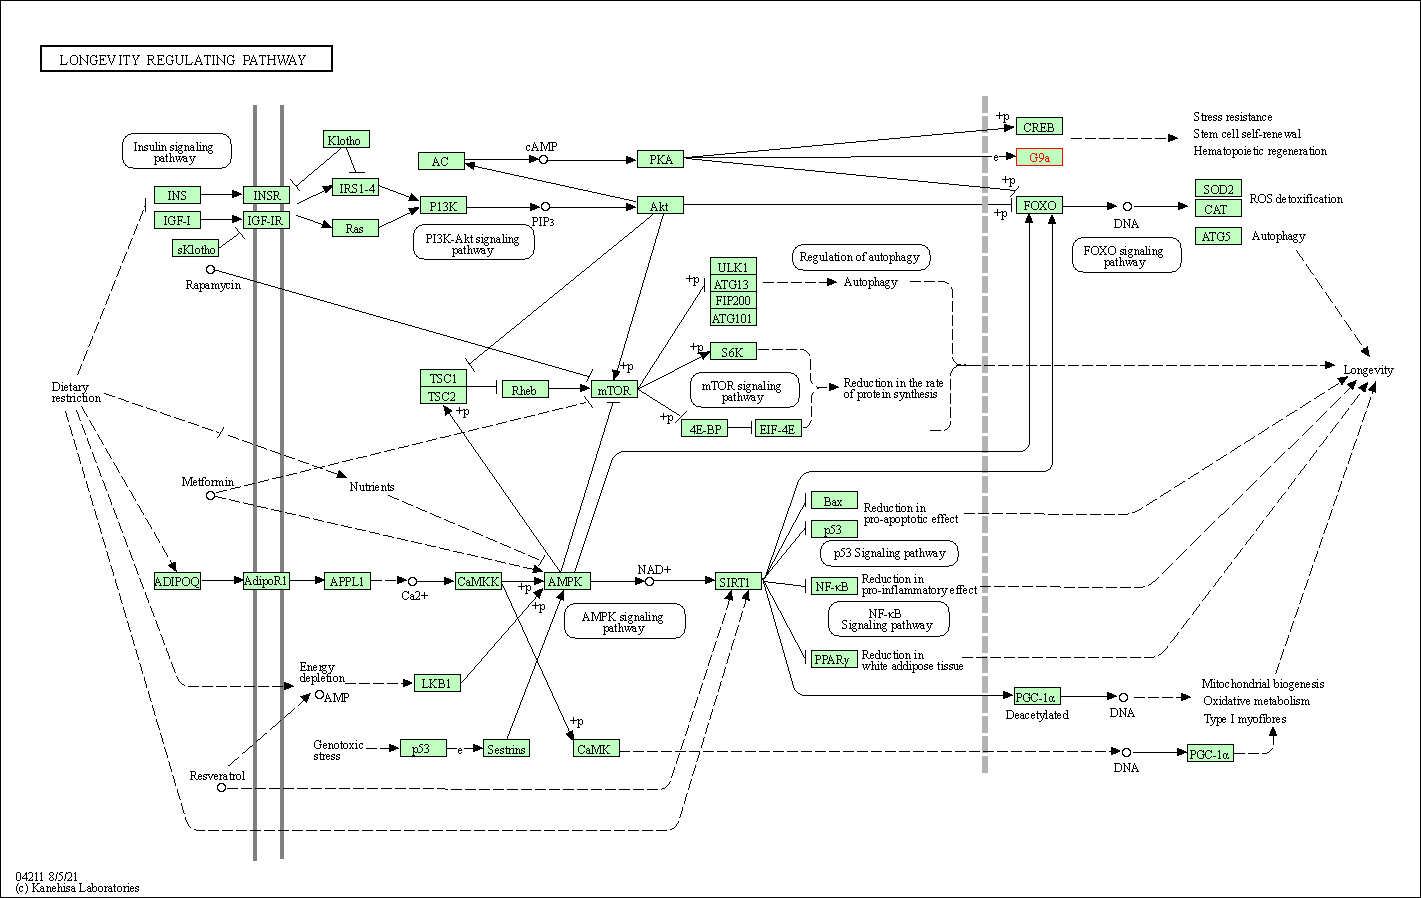
Human Pathway Affiliation
of target is determined by the life-essential pathways provided on KEGG database. The target-affiliated pathways were defined based on the following two criteria (a) the pathways of the studied target should be life-essential for both healthy individuals and patients, and (b) the studied target should occupy an upstream position in the pathways and therefore had the ability to regulate biological function.
Targets involved in a fewer pathways have greater likelihood to be successfully developed, while those associated with more human pathways increase the chance of undesirable interferences with other human processes
(Pharmacol Rev, 58: 259-279, 2006).
Biological Network Descriptors
of target is determined based on a human protein-protein interactions (PPI) network consisting of 9,309 proteins and 52,713 PPIs, which were with a high confidence score of ≥ 0.95 collected from STRING database.
The network properties of targets based on protein-protein interactions (PPIs) have been widely adopted for the assessment of target’s druggability. Proteins with high node degree tend to have a high impact on network function through multiple interactions, while proteins with high betweenness centrality are regarded to be central for communication in interaction networks and regulate the flow of signaling information
(Front Pharmacol, 9, 1245, 2018;
Curr Opin Struct Biol. 44:134-142, 2017).
Human Similarity Proteins
Human Tissue Distribution
Human Pathway Affiliation
Biological Network Descriptors
|
|
|
Note:
If a protein has TS (tissue specficity) scores at least in one tissue >= 2.5, this protein is called tissue-enriched (including tissue-enriched-but-not-specific and tissue-specific). In the plots, the vertical lines are at thresholds 2.5 and 4.
|
| KEGG Pathway | Pathway ID | Affiliated Target | Pathway Map |
|---|---|---|---|
| Lysine degradation | hsa00310 | Affiliated Target |

|
| Class: Metabolism => Amino acid metabolism | Pathway Hierarchy | ||
| Longevity regulating pathway | hsa04211 | Affiliated Target |

|
| Class: Organismal Systems => Aging | Pathway Hierarchy | ||
| Degree | 15 | Degree centrality | 1.61E-03 | Betweenness centrality | 6.84E-04 |
|---|---|---|---|---|---|
| Closeness centrality | 2.36E-01 | Radiality | 1.41E+01 | Clustering coefficient | 1.62E-01 |
| Neighborhood connectivity | 4.15E+01 | Topological coefficient | 9.20E-02 | Eccentricity | 12 |
| Download | Click to Download the Full PPI Network of This Target | ||||
| Chemical Structure based Activity Landscape of Target | Top |
|---|---|
| Drug Property Profile of Target | Top | |
|---|---|---|
| (1) Molecular Weight (mw) based Drug Clustering | (2) Octanol/Water Partition Coefficient (xlogp) based Drug Clustering | |
|
|
||
| (3) Hydrogen Bond Donor Count (hbonddonor) based Drug Clustering | (4) Hydrogen Bond Acceptor Count (hbondacc) based Drug Clustering | |
|
|
||
| (5) Rotatable Bond Count (rotbonds) based Drug Clustering | (6) Topological Polar Surface Area (polararea) based Drug Clustering | |
|
|
||
| "RO5" indicates the cutoff set by lipinski's rule of five; "D123AB" colored in GREEN denotes the no violation of any cutoff in lipinski's rule of five; "D123AB" colored in PURPLE refers to the violation of only one cutoff in lipinski's rule of five; "D123AB" colored in BLACK represents the violation of more than one cutoffs in lipinski's rule of five | ||
| Target Poor or Non Binders | Top | |||||
|---|---|---|---|---|---|---|
| Target Poor or Non Binders | ||||||
| Target Regulators | Top | |||||
|---|---|---|---|---|---|---|
| Target-interacting Proteins | ||||||
| References | Top | |||||
|---|---|---|---|---|---|---|
| REF 1 | Protein lysine methyltransferase G9a inhibitors: design, synthesis, and structure activity relationships of 2,4-diamino-7-aminoalkoxy-quinazolines. J Med Chem. 2010 Aug 12;53(15):5844-57. | |||||
| REF 2 | Epigenetics and beyond: targeting writers of protein lysine methylation to treat disease. Nat Rev Drug Discov. 2021 Apr;20(4):265-286. | |||||
| REF 3 | Discovery and development of potent and selective inhibitors of histone methyltransferase g9a. ACS Med Chem Lett. 2014 Jan 2;5(2):205-9. | |||||
| REF 4 | Reversal of H3K9me2 by a small-molecule inhibitor for the G9a histone methyltransferase. Mol Cell. 2007 Feb 9;25(3):473-81. | |||||
| REF 5 | A small-molecule probe of the histone methyltransferase G9a induces cellular senescence in pancreatic adenocarcinoma. ACS Chem Biol. 2012 Jul 20;7(7):1152-7. | |||||
| REF 6 | A chemical probe selectively inhibits G9a and GLP methyltransferase activity in cells. Nat Chem Biol. 2011 Jul 10;7(8):566-74. | |||||
| REF 7 | Discovery of an in vivo chemical probe of the lysine methyltransferases G9a and GLP. J Med Chem. 2013 Nov 14;56(21):8931-42. | |||||
| REF 8 | Structure-activity relationship studies of G9a-like protein (GLP) inhibitors. Bioorg Med Chem. 2017 Aug 15;25(16):4414-4423. | |||||
| REF 9 | S-adenosyl methionine is necessary for inhibition of the methyltransferase G9a by the lysine 9 to methionine mutation on histone H3. Proc Natl Acad Sci U S A. 2016 May 31;113(22):6182-7. | |||||
If You Find Any Error in Data or Bug in Web Service, Please Kindly Report It to Dr. Zhou and Dr. Zhang.

