Target Information
| Target General Information | Top | |||||
|---|---|---|---|---|---|---|
| Target ID |
T33367
(Former ID: TTDR00222)
|
|||||
| Target Name |
Cytoplasmic aspartate aminotransferase (GOT1)
|
|||||
| Synonyms |
Glutamate oxaloacetate transaminase-1; GOT1
Click to Show/Hide
|
|||||
| Gene Name |
GOT1
|
|||||
| Target Type |
Literature-reported target
|
[1] | ||||
| Function |
Biosynthesis of L-glutamate from L-aspartate or L- cysteine. Important regulator of levels of glutamate, the major excitatory neurotransmitter of the vertebrate central nervous system. Acts as a scavenger of glutamate in brain neuroprotection. The aspartate aminotransferase activity is involved in hepatic glucose synthesis during development and in adipocyte glyceroneogenesis. Using L-cysteine as substrate, regulates levels of mercaptopyruvate, an important source of hydrogen sulfide. Mercaptopyruvate is converted into H(2)S via the action of 3- mercaptopyruvate sulfurtransferase (3MST). Hydrogen sulfide is an important synaptic modulator and neuroprotectant in the brain.
Click to Show/Hide
|
|||||
| BioChemical Class |
Transaminase
|
|||||
| UniProt ID | ||||||
| EC Number |
EC 2.6.1.1
|
|||||
| Sequence |
MAPPSVFAEVPQAQPVLVFKLTADFREDPDPRKVNLGVGAYRTDDCHPWVLPVVKKVEQK
IANDNSLNHEYLPILGLAEFRSCASRLALGDDSPALKEKRVGGVQSLGGTGALRIGADFL ARWYNGTNNKNTPVYVSSPTWENHNAVFSAAGFKDIRSYRYWDAEKRGLDLQGFLNDLEN APEFSIVVLHACAHNPTGIDPTPEQWKQIASVMKHRFLFPFFDSAYQGFASGNLERDAWA IRYFVSEGFEFFCAQSFSKNFGLYNERVGNLTVVGKEPESILQVLSQMEKIVRITWSNPP AQGARIVASTLSNPELFEEWTGNVKTMADRILTMRSELRARLEALKTPGTWNHITDQIGM FSFTGLNPKQVEYLVNEKHIYLLPSGRINVSGLTTKNLDYVATSIHEAVTKIQ Click to Show/Hide
|
|||||
| 3D Structure | Click to Show 3D Structure of This Target | PDB | ||||
| ADReCS ID | BADD_A01161 ; BADD_A01511 | |||||
| HIT2.0 ID | T42Q3K | |||||
| Cell-based Target Expression Variations | Top | |||||
|---|---|---|---|---|---|---|
| Cell-based Target Expression Variations | ||||||
| Drug Binding Sites of Target | Top | |||||
|---|---|---|---|---|---|---|
| Ligand Name: Pyridoxal phosphate | Ligand Info | |||||
| Structure Description | Crystal structure of human Glutamate oxaloacetate transaminase 1 (GOT1) | PDB:3II0 | ||||
| Method | X-ray diffraction | Resolution | 2.05 Å | Mutation | No | [3] |
| PDB Sequence |
PVLVFKLTAD
24 FREDPDPRKV34 NLGVGAYRTD44 DCHPWVLPVV54 KKVEQKIAND64 NSLNHEYLPI 74 LGLAEFRSCA84 SRLALGDDSP94 ALKEKRVGGV104 QSLGGTGALR114 IGADFLARWY 124 NGTNNKNTPV134 YVSSPTWENH144 NAVFSAAGFK154 DIRSYRYWDA164 EKRGLDLQGF 174 LNDLENAPEF184 SIVVLHACAH194 NPTGIDPTPE204 QWKQIASVMK214 HRFLFPFFDS 224 AYQGFASGNL234 ERDAWAIRYF244 VSEGFEFFCA254 QSFSKNFGLY264 NERVGNLTVV 274 GKEPESILQV284 LSQMEKIVRI294 TWSNPPAQGA304 RIVASTLSNP314 ELFEEWTGNV 324 KTMADRILTM334 RSELRARLEA344 LKTPGTWNHI354 TDQIGMFSFT364 GLNPKQVEYL 374 VNEKHIYLLP384 SGRINVSGLT394 TKNLDYVATS404 IHEAVTKIAE414 NLYFQ |
|||||
|
|
||||||
| Click to View More Binding Site Information of This Target and Ligand Pair | ||||||
| Ligand Name: (5E)-4-hydroxy-3-[4-hydroxy-3-(3-methylbut-2-enyl)phenyl]-5-[[4-hydroxy-3-(3-methylbut-2-enyl)phenyl]methylidene]furan-2-one | Ligand Info | |||||
| Structure Description | Crystal structure of human Glutamate oxaloacetate transaminase 1 (GOT1) in complex with AH | PDB:6LIG | ||||
| Method | X-ray diffraction | Resolution | 2.62 Å | Mutation | No | [4] |
| PDB Sequence |
PPSVFAEVPQ
12 AQPVLVFKLT22 ADFREDPDPR32 KVNLGVGAYR42 TDDCHPWVLP52 VVKKVEQKIA 62 NDNSLNHEYL72 PILGLAEFRS82 CASRLALGDD92 SPALKEKRVG102 GVQSLGGTGA 112 LRIGADFLAR122 WYNGTNNKNT132 PVYVSSPTWE142 NHNAVFSAAG152 FKDIRSYRYW 162 DAEKRGLDLQ172 GFLNDLENAP182 EFSIVVLHAC192 AHNPTGIDPT202 PEQWKQIASV 212 MKHRFLFPFF222 DSAYQGFASG232 NLERDAWAIR242 YFVSEGFEFF252 CAQSFSKNFG 262 LYNERVGNLT272 VVGKEPESIL282 QVLSQMEKIV292 RITWSNPPAQ302 GARIVASTLS 312 NPELFEEWTG322 NVKTMADRIL332 TMRSELRARL342 EALKTPGTWN352 HITDQIGMFS 362 FTGLNPKQVE372 YLVNEKHIYL382 LPSGRINVSG392 LTTKNLDYVA402 TSIHEAVTKI 412
|
|||||
|
|
GLY39
3.204
GLY108
4.103
GLY109
3.161
THR110
3.076
LEU113
3.954
TRP141
2.680
HIS144
4.059
HIS190
4.385
ASN195
3.066
ASP223
2.948
|
|||||
| Click to View More Binding Site Information of This Target with Different Ligands | ||||||
| Different Human System Profiles of Target | Top |
|---|---|
|
Human Similarity Proteins
of target is determined by comparing the sequence similarity of all human proteins with the target based on BLAST. The similarity proteins for a target are defined as the proteins with E-value < 0.005 and outside the protein families of the target.
A target that has fewer human similarity proteins outside its family is commonly regarded to possess a greater capacity to avoid undesired interactions and thus increase the possibility of finding successful drugs
(Brief Bioinform, 21: 649-662, 2020).
Human Tissue Distribution
of target is determined from a proteomics study that quantified more than 12,000 genes across 32 normal human tissues. Tissue Specificity (TS) score was used to define the enrichment of target across tissues.
The distribution of targets among different tissues or organs need to be taken into consideration when assessing the target druggability, as it is generally accepted that the wider the target distribution, the greater the concern over potential adverse effects
(Nat Rev Drug Discov, 20: 64-81, 2021).
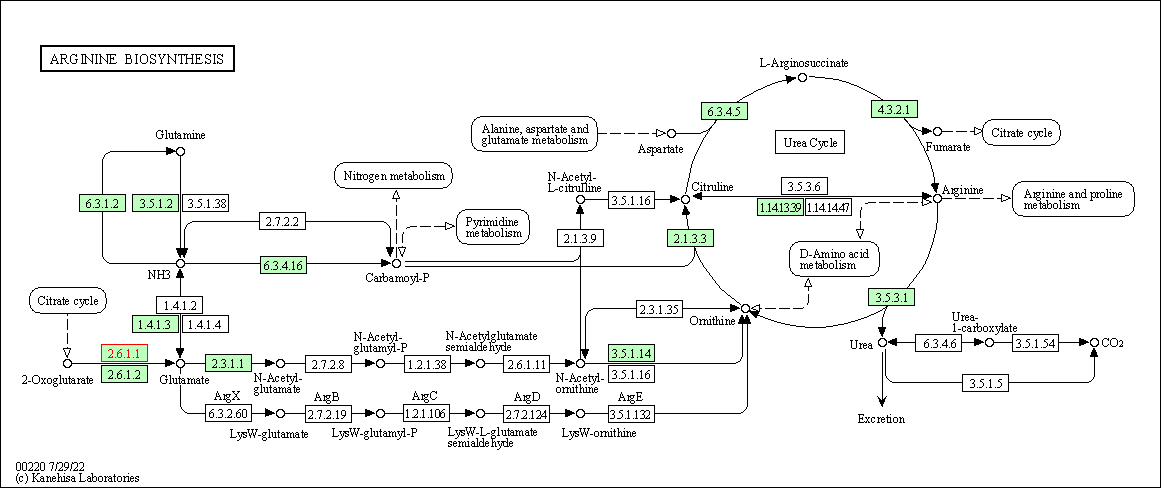
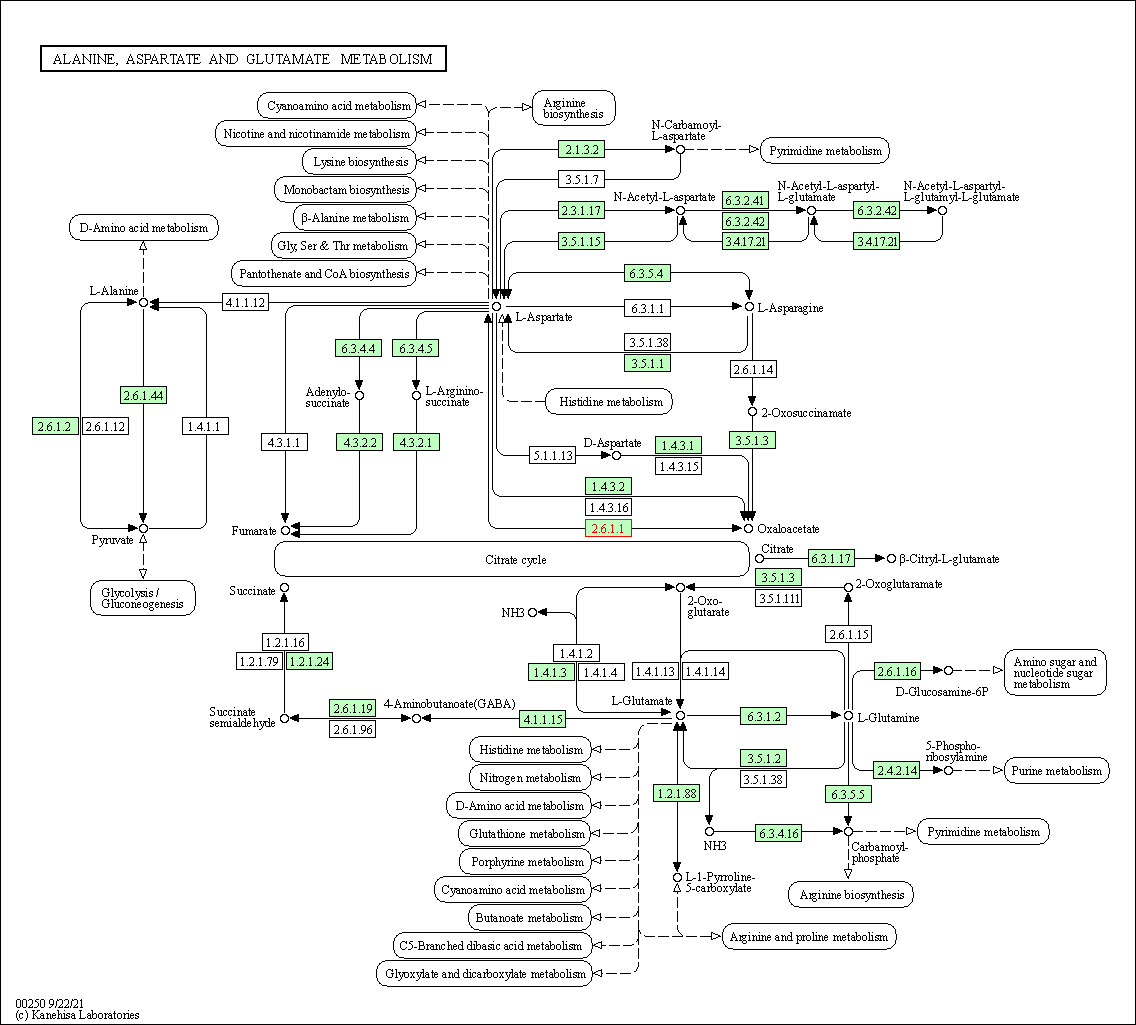
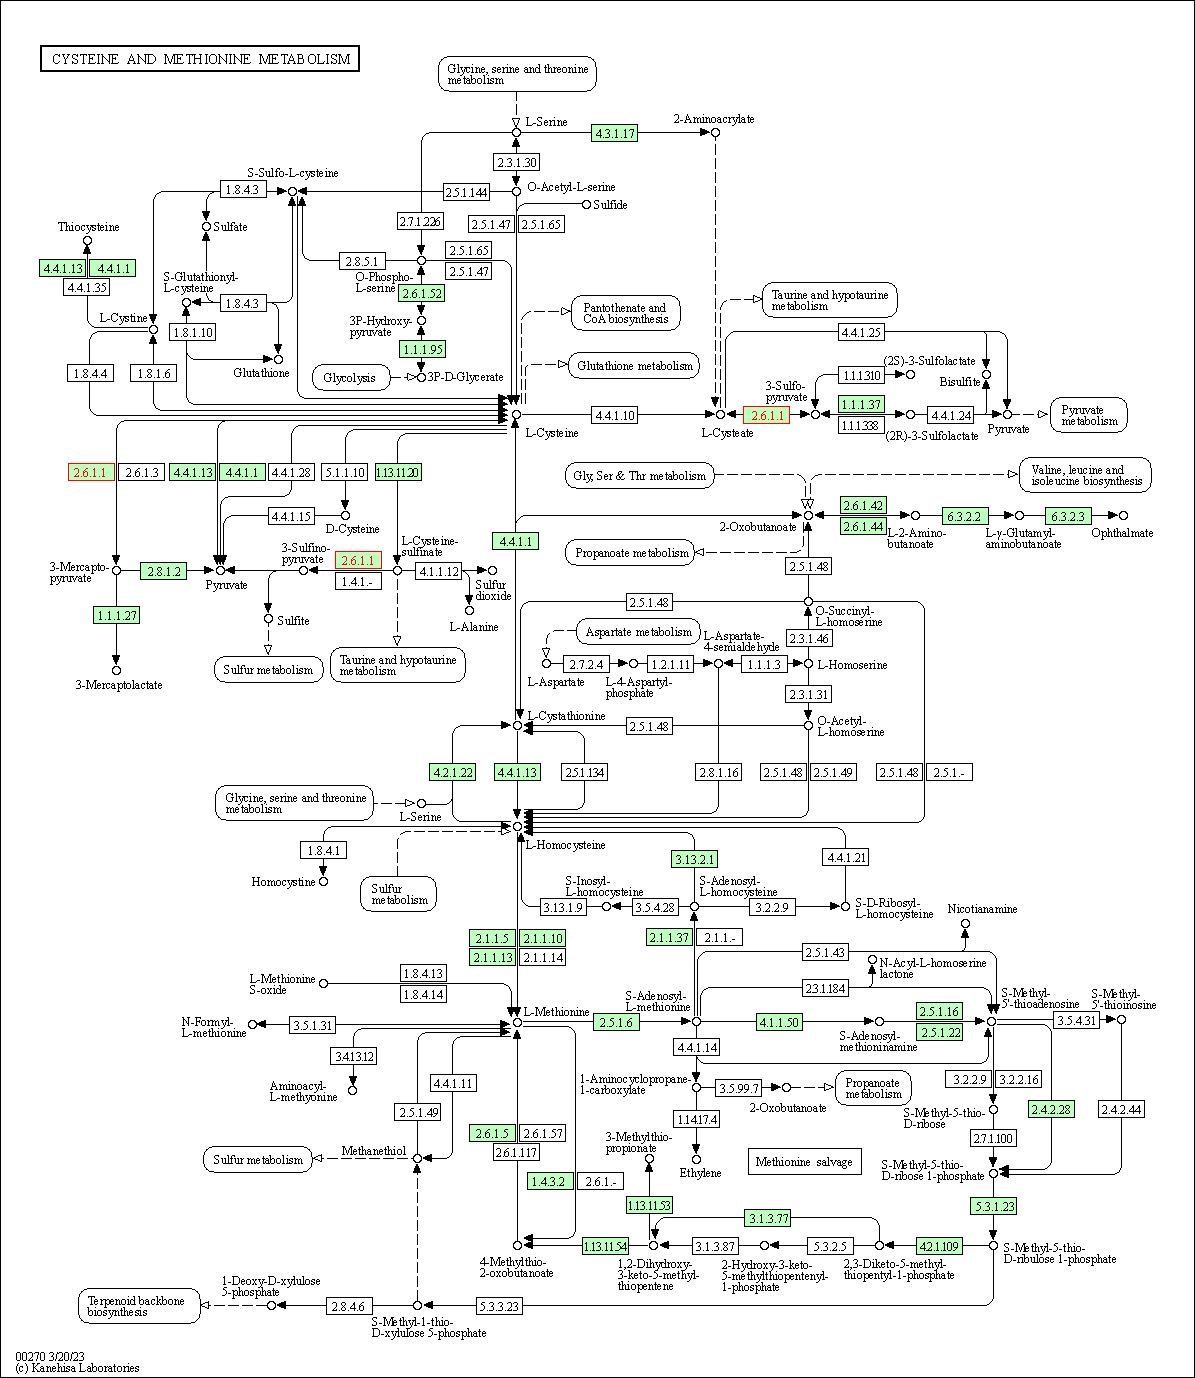
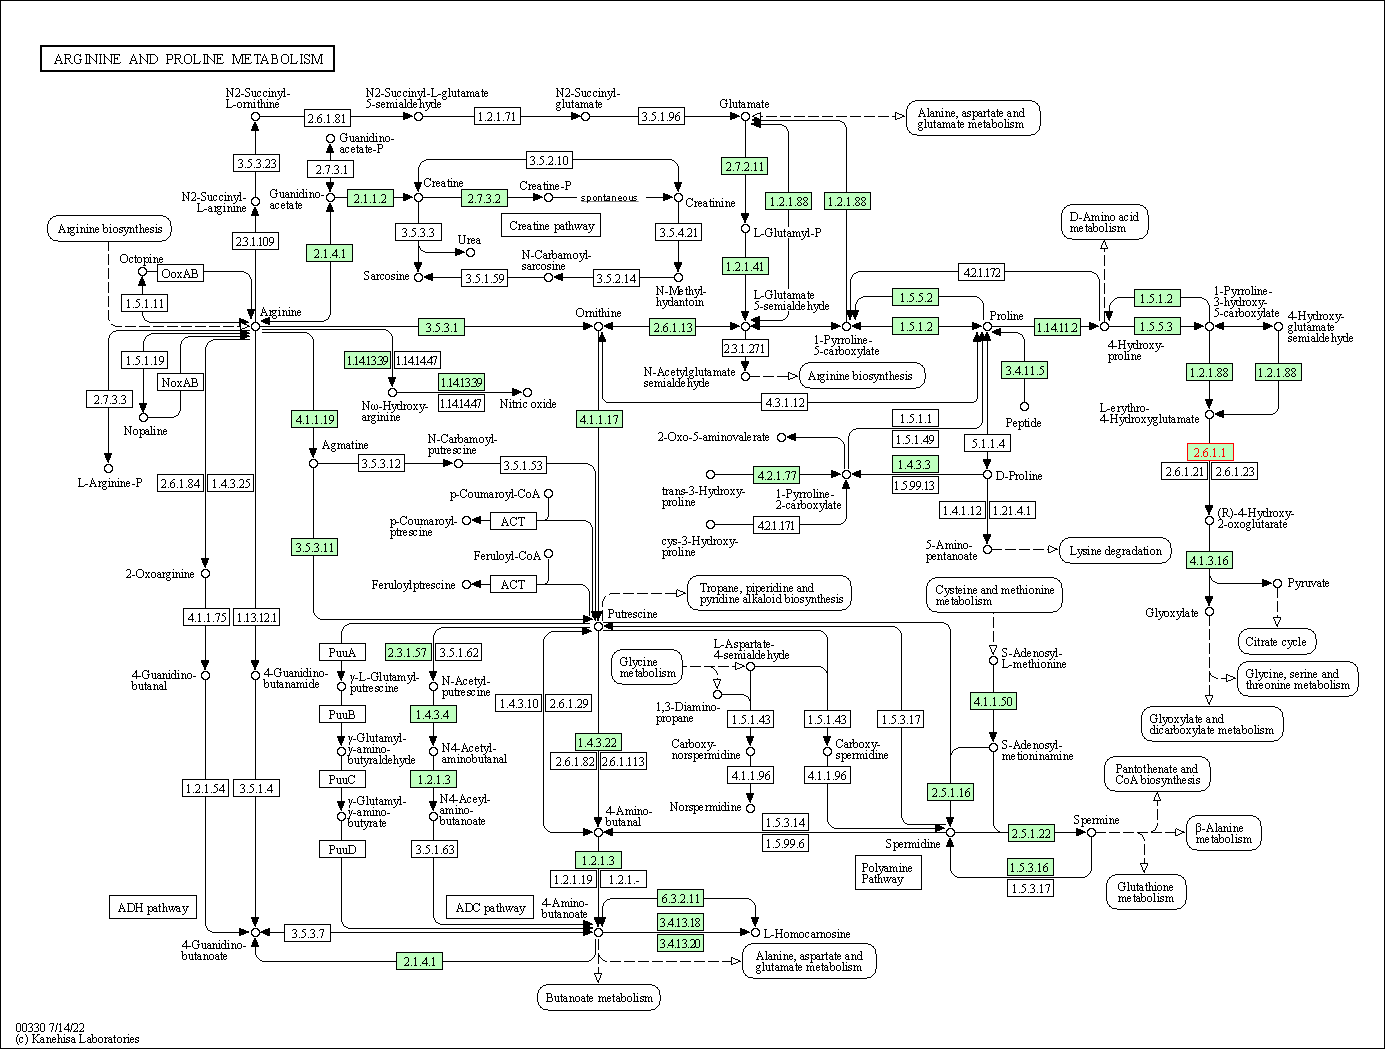
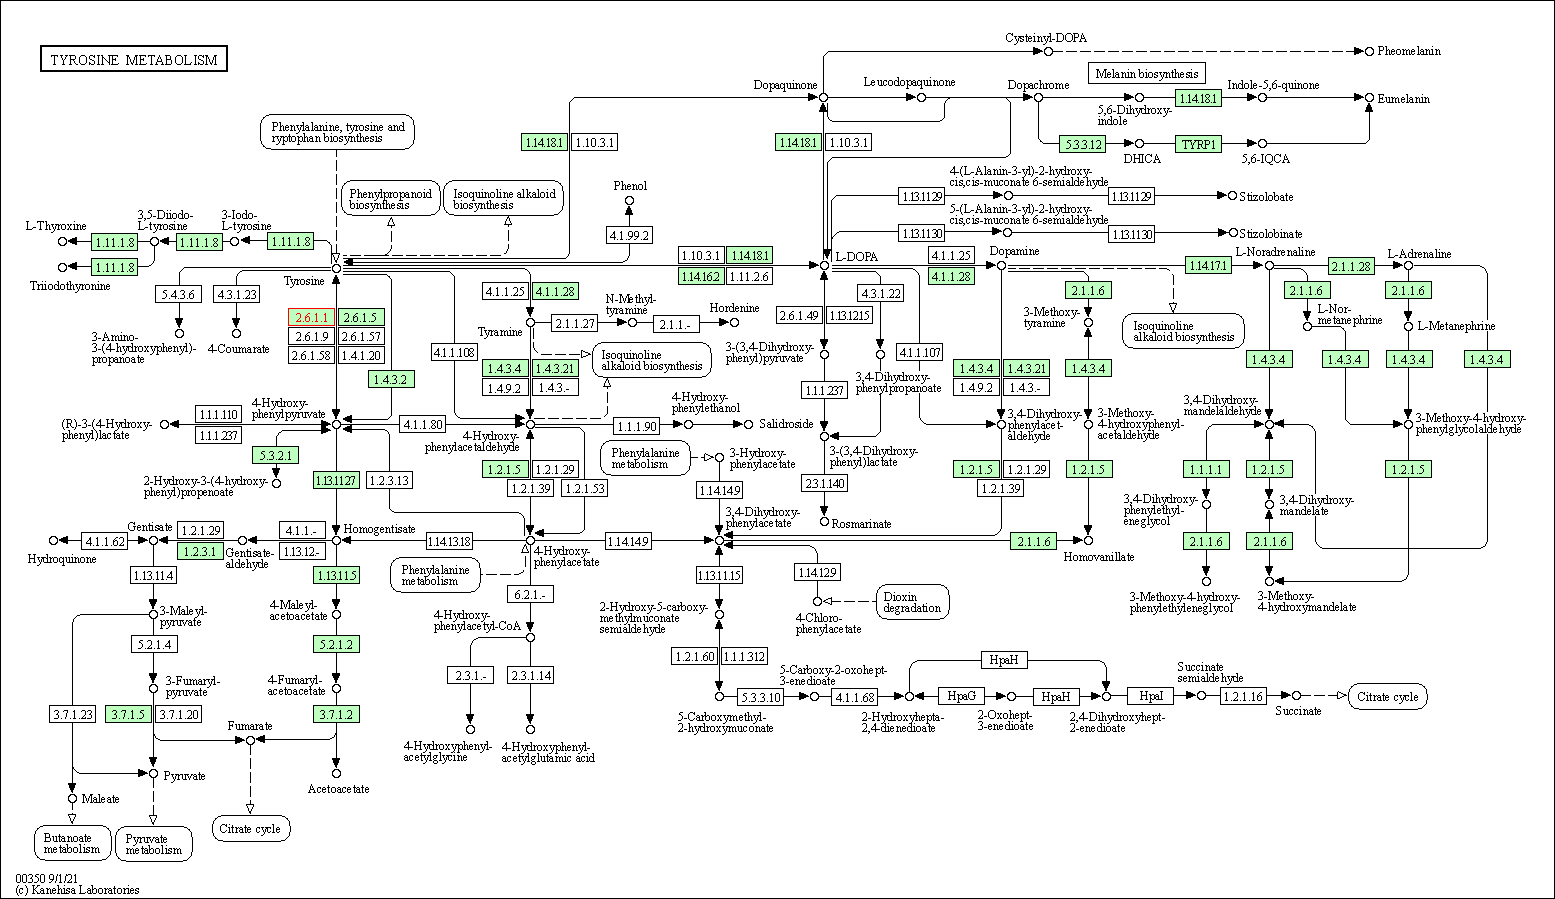
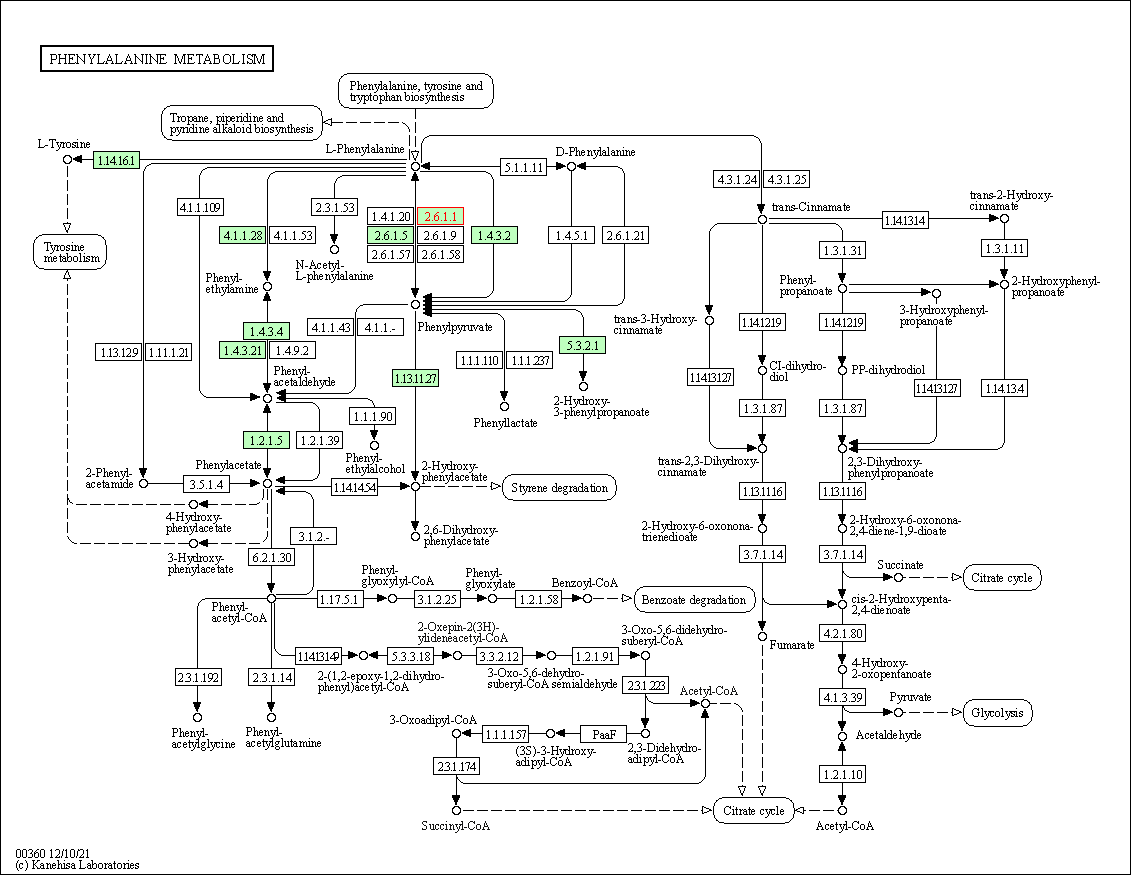
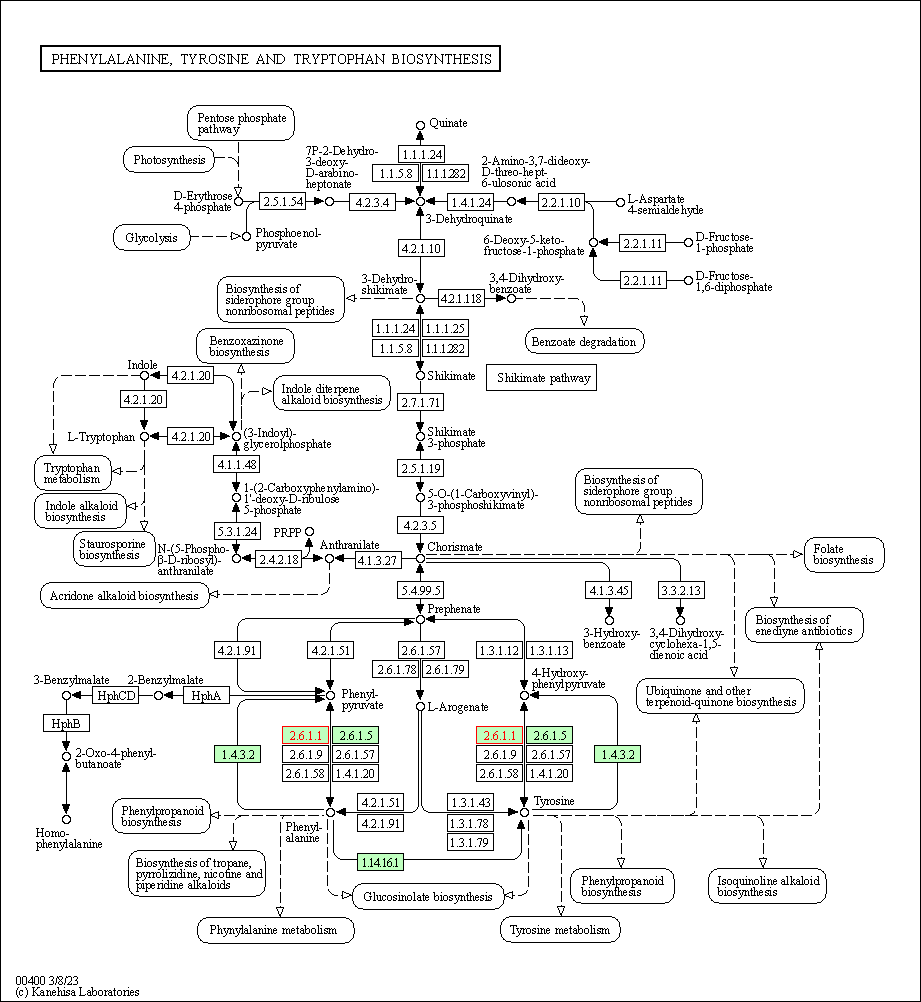
Human Pathway Affiliation
of target is determined by the life-essential pathways provided on KEGG database. The target-affiliated pathways were defined based on the following two criteria (a) the pathways of the studied target should be life-essential for both healthy individuals and patients, and (b) the studied target should occupy an upstream position in the pathways and therefore had the ability to regulate biological function.
Targets involved in a fewer pathways have greater likelihood to be successfully developed, while those associated with more human pathways increase the chance of undesirable interferences with other human processes
(Pharmacol Rev, 58: 259-279, 2006).
Biological Network Descriptors
of target is determined based on a human protein-protein interactions (PPI) network consisting of 9,309 proteins and 52,713 PPIs, which were with a high confidence score of ≥ 0.95 collected from STRING database.
The network properties of targets based on protein-protein interactions (PPIs) have been widely adopted for the assessment of target’s druggability. Proteins with high node degree tend to have a high impact on network function through multiple interactions, while proteins with high betweenness centrality are regarded to be central for communication in interaction networks and regulate the flow of signaling information
(Front Pharmacol, 9, 1245, 2018;
Curr Opin Struct Biol. 44:134-142, 2017).
Human Similarity Proteins
Human Tissue Distribution
Human Pathway Affiliation
Biological Network Descriptors
|
|
|
There is no similarity protein (E value < 0.005) for this target
|
|
Note:
If a protein has TS (tissue specficity) scores at least in one tissue >= 2.5, this protein is called tissue-enriched (including tissue-enriched-but-not-specific and tissue-specific). In the plots, the vertical lines are at thresholds 2.5 and 4.
|
| KEGG Pathway | Pathway ID | Affiliated Target | Pathway Map |
|---|---|---|---|
| Arginine biosynthesis | hsa00220 | Affiliated Target |
|
| Class: Metabolism => Amino acid metabolism | Pathway Hierarchy | ||
| Alanine, aspartate and glutamate metabolism | hsa00250 | Affiliated Target |
|
| Class: Metabolism => Amino acid metabolism | Pathway Hierarchy | ||
| Cysteine and methionine metabolism | hsa00270 | Affiliated Target |
|
| Class: Metabolism => Amino acid metabolism | Pathway Hierarchy | ||
| Arginine and proline metabolism | hsa00330 | Affiliated Target |
|
| Class: Metabolism => Amino acid metabolism | Pathway Hierarchy | ||
| Tyrosine metabolism | hsa00350 | Affiliated Target |
|
| Class: Metabolism => Amino acid metabolism | Pathway Hierarchy | ||
| Phenylalanine metabolism | hsa00360 | Affiliated Target |
|
| Class: Metabolism => Amino acid metabolism | Pathway Hierarchy | ||
| Phenylalanine, tyrosine and tryptophan biosynthesis | hsa00400 | Affiliated Target |
|
| Class: Metabolism => Amino acid metabolism | Pathway Hierarchy | ||
| Click to Show/Hide the Information of Affiliated Human Pathways | |||
| Degree | 10 | Degree centrality | 1.07E-03 | Betweenness centrality | 4.84E-04 |
|---|---|---|---|---|---|
| Closeness centrality | 1.75E-01 | Radiality | 1.28E+01 | Clustering coefficient | 1.56E-01 |
| Neighborhood connectivity | 1.03E+01 | Topological coefficient | 1.56E-01 | Eccentricity | 13 |
| Download | Click to Download the Full PPI Network of This Target | ||||
| Chemical Structure based Activity Landscape of Target | Top |
|---|---|
| Target Poor or Non Binders | Top | |||||
|---|---|---|---|---|---|---|
| Target Poor or Non Binders | ||||||
| References | Top | |||||
|---|---|---|---|---|---|---|
| REF 1 | The Protein Data Bank. Nucleic Acids Res. 2000 Jan 1;28(1):235-42. | |||||
| REF 2 | Aspartate aminotransferase isotope exchange reactions: implications for glutamate/glutamine shuttle hypothesis. Am J Physiol Cell Physiol. 2002 Jun;282(6):C1404-13. | |||||
| REF 3 | Crystal structure of human Glutamate oxaloacetate transaminase 1 (GOT1) | |||||
| REF 4 | Crystal structure of human Glutamate oxaloacetate transaminase 1 (GOT1) in complex with AH | |||||
If You Find Any Error in Data or Bug in Web Service, Please Kindly Report It to Dr. Zhou and Dr. Zhang.

