Target Information
| Target General Information | Top | |||||
|---|---|---|---|---|---|---|
| Target ID |
T32386
(Former ID: TTDR00582)
|
|||||
| Target Name |
Endocytic receptor Endo180 (MRC2)
|
|||||
| Synonyms |
Urokinase-type plasminogen activator receptor-associated protein; Urokinase receptor-associated protein; UPARAP; UPAR-associated protein; Macrophage mannose receptor 2; KIAA0709; Endocytic receptor 180; ENDO180; CLEC13E; CD280; C-type mannose receptor 2; C-type lectin domain family 13 member E
Click to Show/Hide
|
|||||
| Gene Name |
MRC2
|
|||||
| Target Type |
Literature-reported target
|
[1] | ||||
| Function |
May play a role as endocytotic lectin receptor displaying calcium-dependent lectin activity. Internalizes glycosylated ligands from the extracellular space for release in an endosomal compartment via clathrin-mediated endocytosis. May be involved in plasminogen activation system controlling the extracellular level of PLAUR/PLAU, and thus may regulate protease activity at the cell surface. May contribute to cellular uptake, remodeling and degradation of extracellular collagen matrices. May play a role during cancer progression as well as in other chronic tissue destructive diseases acting on collagen turnover. May participate in remodeling of extracellular matrix cooperating with the matrix metalloproteinases (MMPs).
Click to Show/Hide
|
|||||
| UniProt ID | ||||||
| Sequence |
MGPGRPAPAPWPRHLLRCVLLLGCLHLGRPGAPGDAALPEPNVFLIFSHGLQGCLEAQGG
QVRVTPACNTSLPAQRWKWVSRNRLFNLGTMQCLGTGWPGTNTTASLGMYECDREALNLR WHCRTLGDQLSLLLGARTSNISKPGTLERGDQTRSGQWRIYGSEEDLCALPYHEVYTIQG NSHGKPCTIPFKYDNQWFHGCTSTGREDGHLWCATTQDYGKDERWGFCPIKSNDCETFWD KDQLTDSCYQFNFQSTLSWREAWASCEQQGADLLSITEIHEQTYINGLLTGYSSTLWIGL NDLDTSGGWQWSDNSPLKYLNWESDQPDNPSEENCGVIRTESSGGWQNRDCSIALPYVCK KKPNATAEPTPPDRWANVKVECEPSWQPFQGHCYRLQAEKRSWQESKKACLRGGGDLVSI HSMAELEFITKQIKQEVEELWIGLNDLKLQMNFEWSDGSLVSFTHWHPFEPNNFRDSLED CVTIWGPEGRWNDSPCNQSLPSICKKAGQLSQGAAEEDHGCRKGWTWHSPSCYWLGEDQV TYSEARRLCTDHGSQLVTITNRFEQAFVSSLIYNWEGEYFWTALQDLNSTGSFFWLSGDE VMYTHWNRDQPGYSRGGCVALATGSAMGLWEVKNCTSFRARYICRQSLGTPVTPELPGPD PTPSLTGSCPQGWASDTKLRYCYKVFSSERLQDKKSWVQAQGACQELGAQLLSLASYEEE HFVANMLNKIFGESEPEIHEQHWFWIGLNRRDPRGGQSWRWSDGVGFSYHNFDRSRHDDD DIRGCAVLDLASLQWVAMQCDTQLDWICKIPRGTDVREPDDSPQGRREWLRFQEAEYKFF EHHSTWAQAQRICTWFQAELTSVHSQAELDFLSHNLQKFSRAQEQHWWIGLHTSESDGRF RWTDGSIINFISWAPGKPRPVGKDKKCVYMTASREDWGDQRCLTALPYICKRSNVTKETQ PPDLPTTALGGCPSDWIQFLNKCFQVQGQEPQSRVKWSEAQFSCEQQEAQLVTITNPLEQ AFITASLPNVTFDLWIGLHASQRDFQWVEQEPLMYANWAPGEPSGPSPAPSGNKPTSCAV VLHSPSAHFTGRWDDRSCTEETHGFICQKGTDPSLSPSPAALPPAPGTELSYLNGTFRLL QKPLRWHDALLLCESRNASLAYVPDPYTQAFLTQAARGLRTPLWIGLAGEEGSRRYSWVS EEPLNYVGWQDGEPQQPGGCTYVDVDGAWRTTSCDTKLQGAVCGVSSGPPPPRRISYHGS CPQGLADSAWIPFREHCYSFHMELLLGHKEARQRCQRAGGAVLSILDEMENVFVWEHLQS YEGQSRGAWLGMNFNPKGGTLVWQDNTAVNYSNWGPPGLGPSMLSHNSCYWIQSNSGLWR PGACTNITMGVVCKLPRAEQSSFSPSALPENPAALVVVLMAVLLLLALLTAALILYRRRQ SIERGAFEGARYSRSSSSPTEATEKNILVSDMEMNEQQE Click to Show/Hide
|
|||||
| Cell-based Target Expression Variations | Top | |||||
|---|---|---|---|---|---|---|
| Cell-based Target Expression Variations | ||||||
| Drug Binding Sites of Target | Top | |||||
|---|---|---|---|---|---|---|
| Ligand Name: 3,6,9,12,15,18,21,24-Octaoxahexacosan-1-OL | Ligand Info | |||||
| Structure Description | Structure of ligand binding region of uPARAP at pH 7.4 | PDB:5E4K | ||||
| Method | X-ray diffraction | Resolution | 2.58 Å | Mutation | Yes | [2] |
| PDB Sequence |
ALPEPNIFLI
46 FSHGLQGCLE56 AQGGQVRVTP66 ACNTSLPAQR76 WKWVSRNRLF86 NLGTMQCLGT 96 ASLGMYECDR114 EALNLRWHCR124 TLGDQLSLLL134 QWRIYGSEED166 LCALPYHEVY 176 TIQGNSHGKP186 CTIPFKYDNQ196 WFHGCTSTGR206 EDGHLWCATT216 QDYGKDERWG 226 FCPIKSNDCE236 TFWDKDQLTD246 SCYQFNFQST256 LSWREAWASC266 EQQGADLLSI 276 TEIHEQTYIN286 GLLTGYSSTL296 WIGLNDLDTS306 GGWQWSDNSP316 LKYLNWESDQ 326 PDNPSEENCG336 VIRTESSGGW346 QNRDCSIALP356 YVCKKKPVEC382 EPSWQPFQGH 392 CYRLQAEKRS402 WQESKKACLR412 GGGDLVSIHS422 MAELEFITKQ432 IKQEVEELWI 442 GLNDLKLQMN452 FEWSDGSLVS462 FTHWHPFEPN472 NFRDSLEDCV482 TIWGPEGRWN 492 DSPCNQSLPS502 ICKK
|
|||||
|
|
||||||
| Click to View More Binding Site Information of This Target with Different Ligands | ||||||
| Different Human System Profiles of Target | Top |
|---|---|
|
Human Similarity Proteins
of target is determined by comparing the sequence similarity of all human proteins with the target based on BLAST. The similarity proteins for a target are defined as the proteins with E-value < 0.005 and outside the protein families of the target.
A target that has fewer human similarity proteins outside its family is commonly regarded to possess a greater capacity to avoid undesired interactions and thus increase the possibility of finding successful drugs
(Brief Bioinform, 21: 649-662, 2020).
Human Tissue Distribution
of target is determined from a proteomics study that quantified more than 12,000 genes across 32 normal human tissues. Tissue Specificity (TS) score was used to define the enrichment of target across tissues.
The distribution of targets among different tissues or organs need to be taken into consideration when assessing the target druggability, as it is generally accepted that the wider the target distribution, the greater the concern over potential adverse effects
(Nat Rev Drug Discov, 20: 64-81, 2021).
Human Pathway Affiliation
of target is determined by the life-essential pathways provided on KEGG database. The target-affiliated pathways were defined based on the following two criteria (a) the pathways of the studied target should be life-essential for both healthy individuals and patients, and (b) the studied target should occupy an upstream position in the pathways and therefore had the ability to regulate biological function.
Targets involved in a fewer pathways have greater likelihood to be successfully developed, while those associated with more human pathways increase the chance of undesirable interferences with other human processes
(Pharmacol Rev, 58: 259-279, 2006).
Human Similarity Proteins
Human Tissue Distribution
Human Pathway Affiliation
|
|
|
There is no similarity protein (E value < 0.005) for this target
|
|
Note:
If a protein has TS (tissue specficity) scores at least in one tissue >= 2.5, this protein is called tissue-enriched (including tissue-enriched-but-not-specific and tissue-specific). In the plots, the vertical lines are at thresholds 2.5 and 4.
|
| KEGG Pathway | Pathway ID | Affiliated Target | Pathway Map |
|---|---|---|---|
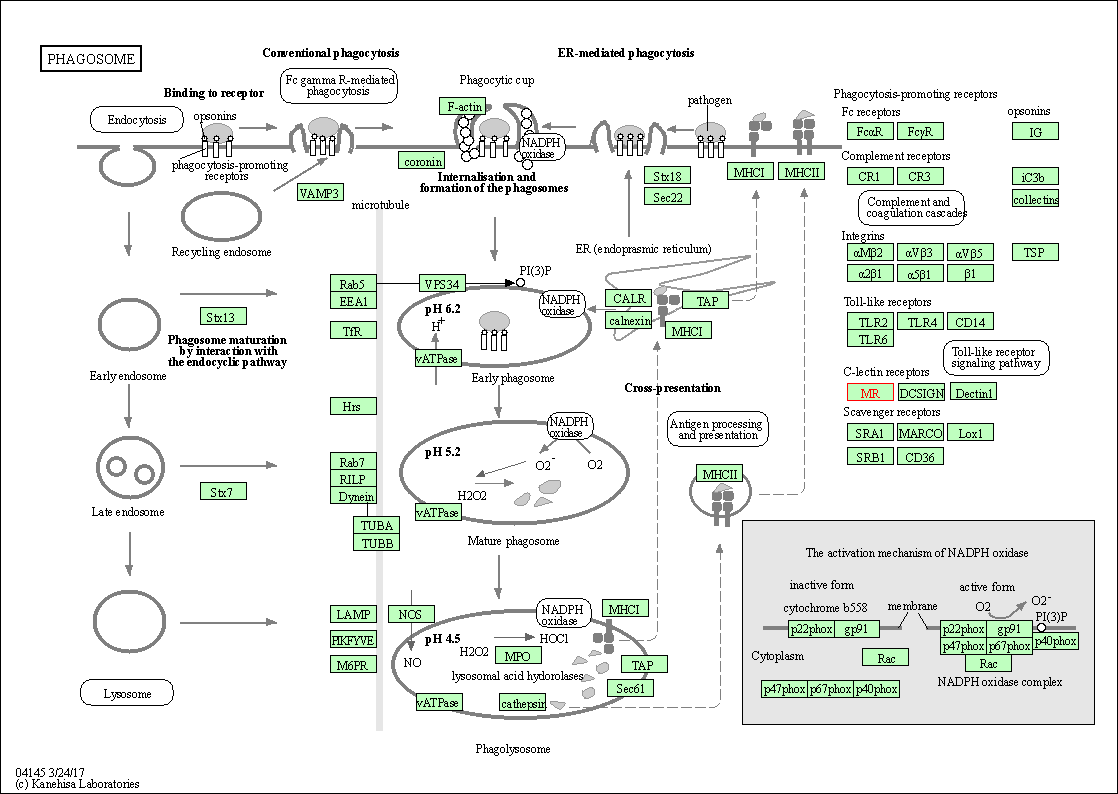
| Phagosome | hsa04145 | Affiliated Target |

|
| Class: Cellular Processes => Transport and catabolism | Pathway Hierarchy | ||
| References | Top | |||||
|---|---|---|---|---|---|---|
| REF 1 | The C-type lectin receptor Endo180 displays internalization and recycling properties distinct from other members of the mannose receptor family. J Biol Chem. 2002 Aug 30;277(35):32320-31. | |||||
| REF 2 | Crystal structures of the ligand-binding region of uPARAP: effect of calcium ion binding. Biochem J. 2016 Aug 1;473(15):2359-68. | |||||
If You Find Any Error in Data or Bug in Web Service, Please Kindly Report It to Dr. Zhou and Dr. Zhang.

