Target Information
| Target General Information | Top | |||||
|---|---|---|---|---|---|---|
| Target ID |
T24373
(Former ID: TTDI02303)
|
|||||
| Target Name |
Lysosomal acid lipase (LIPA)
|
|||||
| Synonyms |
Sterol esterase; Lysosomal acid lipase/cholesteryl ester hydrolase; Lipase A; LIPA; LAL; Cholesteryl esterase; Acid cholesteryl ester hydrolase
Click to Show/Hide
|
|||||
| Gene Name |
LIPA
|
|||||
| Target Type |
Successful target
|
[1] | ||||
| Disease | [+] 1 Target-related Diseases | + | ||||
| 1 | Enzyme deficiency [ICD-11: 5C51-5C57] | |||||
| Function |
Crucial for the intracellular hydrolysis of cholesteryl esters and triglycerides that have been internalized via receptor- mediated endocytosis of lipoprotein particles. Important in mediating the effect of LDL (low density lipoprotein) uptake on suppression of hydroxymethylglutaryl-CoA reductase and activation of endogenous cellular cholesteryl ester formation.
Click to Show/Hide
|
|||||
| BioChemical Class |
Carboxylic ester hydrolase
|
|||||
| UniProt ID | ||||||
| EC Number |
EC 3.1.1.13
|
|||||
| Sequence |
MKMRFLGLVVCLVLWTLHSEGSGGKLTAVDPETNMNVSEIISYWGFPSEEYLVETEDGYI
LCLNRIPHGRKNHSDKGPKPVVFLQHGLLADSSNWVTNLANSSLGFILADAGFDVWMGNS RGNTWSRKHKTLSVSQDEFWAFSYDEMAKYDLPASINFILNKTGQEQVYYVGHSQGTTIG FIAFSQIPELAKRIKMFFALGPVASVAFCTSPMAKLGRLPDHLIKDLFGDKEFLPQSAFL KWLGTHVCTHVILKELCGNLCFLLCGFNERNLNMSRVDVYTTHSPAGTSVQNMLHWSQAV KFQKFQAFDWGSSAKNYFHYNQSYPPTYNVKDMLVPTAVWSGGHDWLADVYDVNILLTQI TNLVFHESIPEWEHLDFIWGLDAPWRLYNKIINLMRKYQ Click to Show/Hide
|
|||||
| 3D Structure | Click to Show 3D Structure of This Target | PDB | ||||
| Drugs and Modes of Action | Top | |||||
|---|---|---|---|---|---|---|
| Approved Drug(s) | [+] 1 Approved Drugs | + | ||||
| 1 | SBC-102 | Drug Info | Approved | Enzyme deficiency | [2] | |
| Mode of Action | [+] 1 Modes of Action | + | ||||
| Modulator | [+] 1 Modulator drugs | + | ||||
| 1 | SBC-102 | Drug Info | [1], [2] | |||
| Cell-based Target Expression Variations | Top | |||||
|---|---|---|---|---|---|---|
| Cell-based Target Expression Variations | ||||||
| Different Human System Profiles of Target | Top |
|---|---|
|
Human Similarity Proteins
of target is determined by comparing the sequence similarity of all human proteins with the target based on BLAST. The similarity proteins for a target are defined as the proteins with E-value < 0.005 and outside the protein families of the target.
A target that has fewer human similarity proteins outside its family is commonly regarded to possess a greater capacity to avoid undesired interactions and thus increase the possibility of finding successful drugs
(Brief Bioinform, 21: 649-662, 2020).
Human Tissue Distribution
of target is determined from a proteomics study that quantified more than 12,000 genes across 32 normal human tissues. Tissue Specificity (TS) score was used to define the enrichment of target across tissues.
The distribution of targets among different tissues or organs need to be taken into consideration when assessing the target druggability, as it is generally accepted that the wider the target distribution, the greater the concern over potential adverse effects
(Nat Rev Drug Discov, 20: 64-81, 2021).
Human Pathway Affiliation
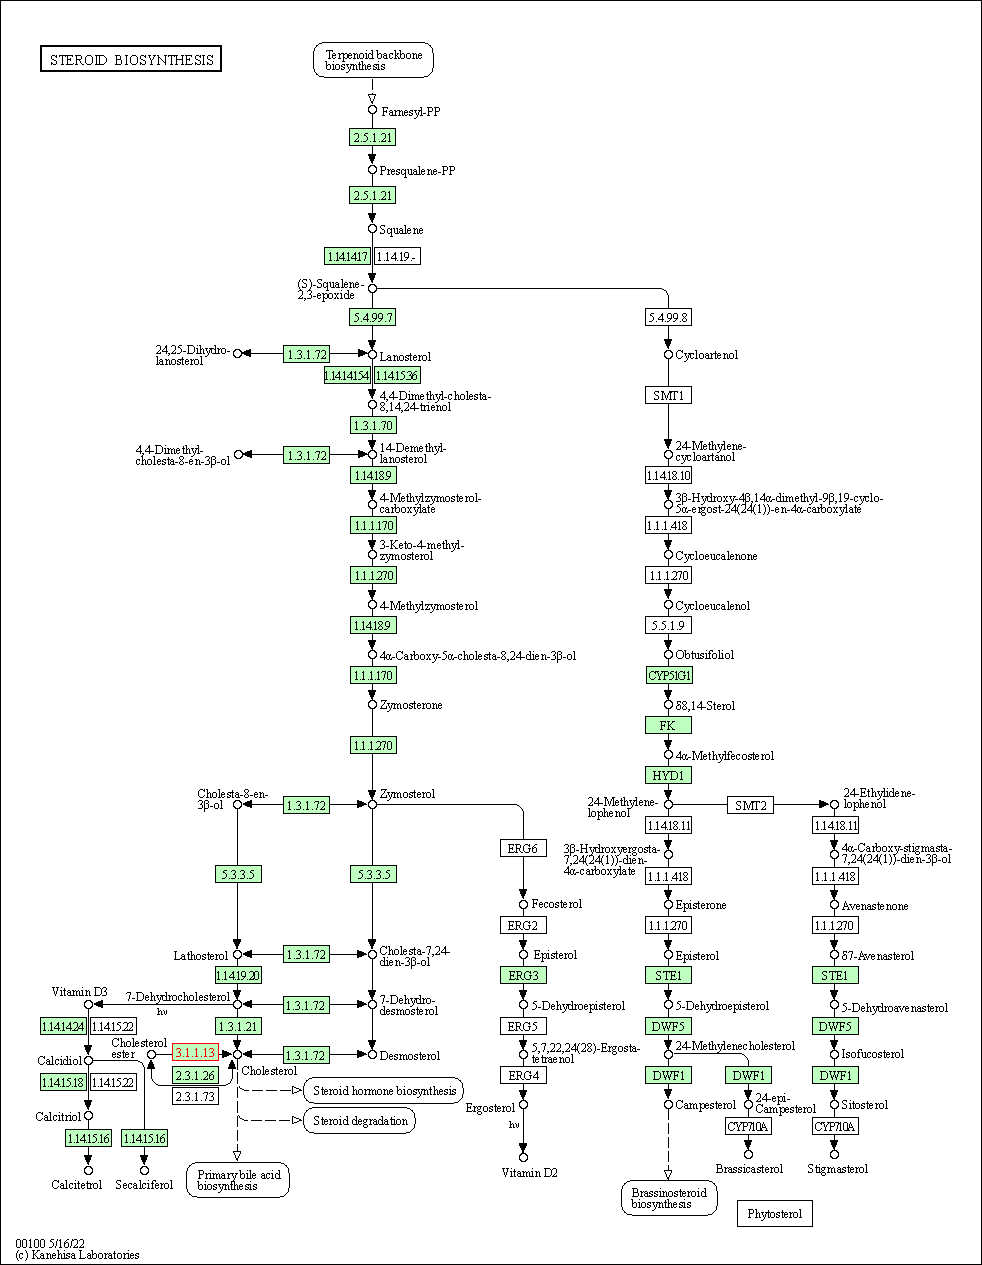
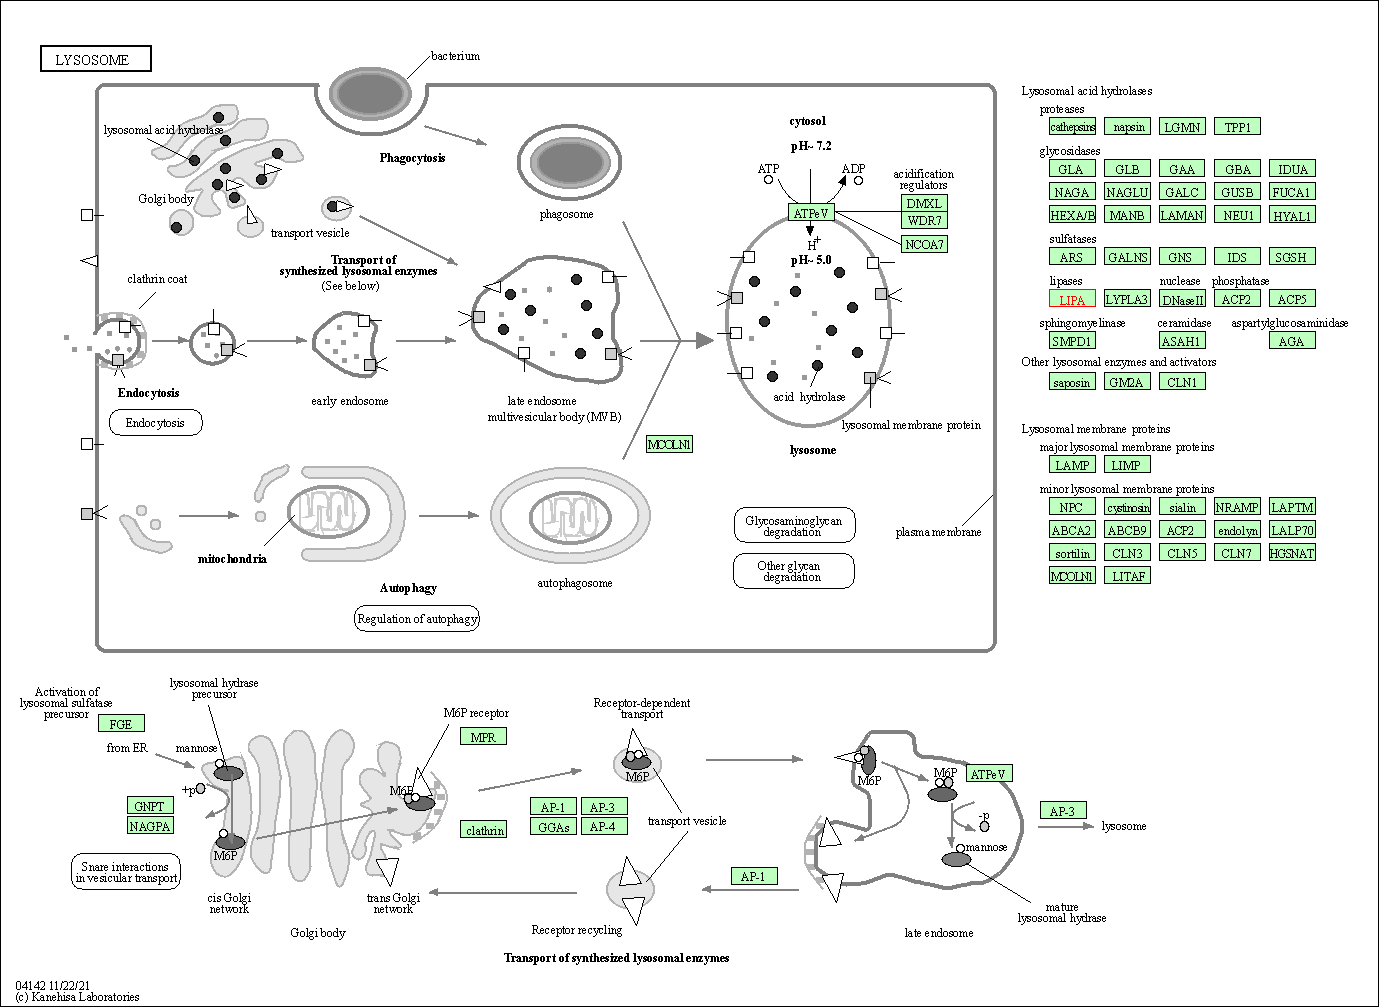
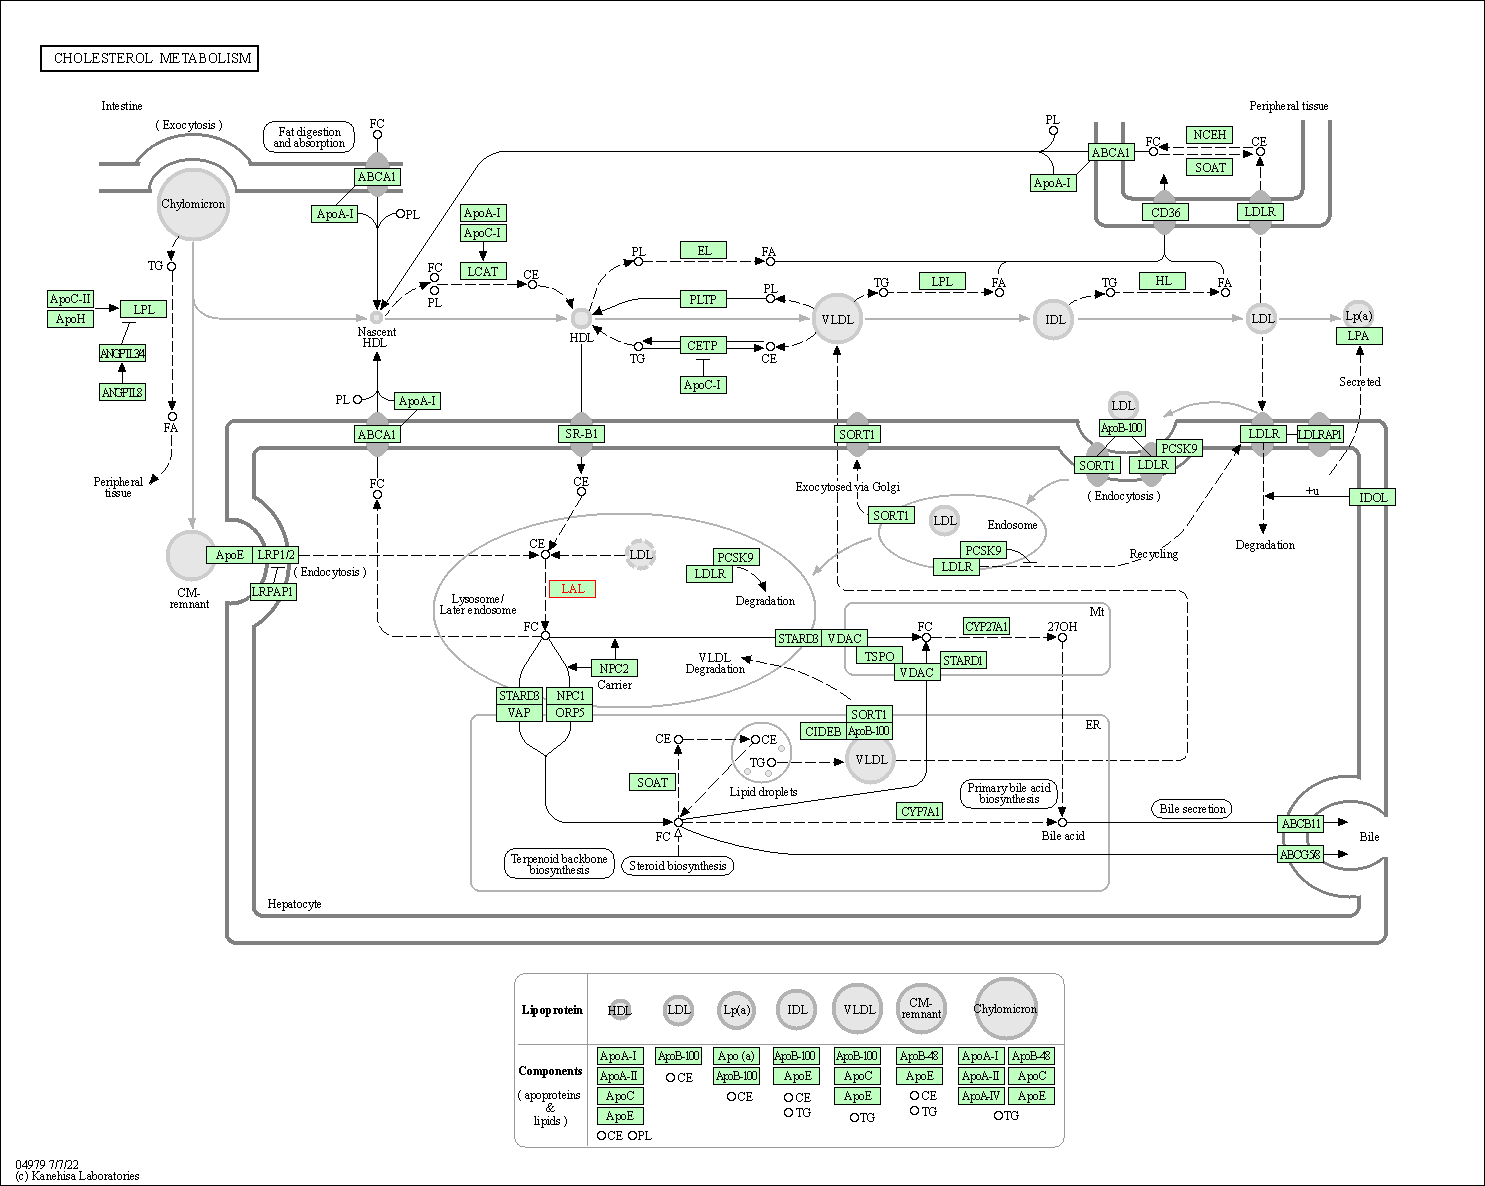
of target is determined by the life-essential pathways provided on KEGG database. The target-affiliated pathways were defined based on the following two criteria (a) the pathways of the studied target should be life-essential for both healthy individuals and patients, and (b) the studied target should occupy an upstream position in the pathways and therefore had the ability to regulate biological function.
Targets involved in a fewer pathways have greater likelihood to be successfully developed, while those associated with more human pathways increase the chance of undesirable interferences with other human processes
(Pharmacol Rev, 58: 259-279, 2006).
Human Similarity Proteins
Human Tissue Distribution
Human Pathway Affiliation
|
|
| Protein Name | Pfam ID | Percentage of Identity (%) | E value |
|---|---|---|---|
| Lipase member J (LIPJ) | 53.994 (196/363) | 2.97E-147 |
|
Note:
If a protein has TS (tissue specficity) scores at least in one tissue >= 2.5, this protein is called tissue-enriched (including tissue-enriched-but-not-specific and tissue-specific). In the plots, the vertical lines are at thresholds 2.5 and 4.
|
| KEGG Pathway | Pathway ID | Affiliated Target | Pathway Map |
|---|---|---|---|
| Steroid biosynthesis | hsa00100 | Affiliated Target |

|
| Class: Metabolism => Lipid metabolism | Pathway Hierarchy | ||
| Lysosome | hsa04142 | Affiliated Target |

|
| Class: Cellular Processes => Transport and catabolism | Pathway Hierarchy | ||
| Cholesterol metabolism | hsa04979 | Affiliated Target |

|
| Class: Organismal Systems => Digestive system | Pathway Hierarchy | ||
| Chemical Structure based Activity Landscape of Target | Top |
|---|---|
| Target Poor or Non Binders | Top | |||||
|---|---|---|---|---|---|---|
| Target Poor or Non Binders | ||||||
| Target Affiliated Biological Pathways | Top | |||||
|---|---|---|---|---|---|---|
| KEGG Pathway | [+] 2 KEGG Pathways | + | ||||
| 1 | Steroid biosynthesis | |||||
| 2 | Lysosome | |||||
| Panther Pathway | [+] 1 Panther Pathways | + | ||||
| 1 | Androgen/estrogene/progesterone biosynthesis | |||||
| Pathwhiz Pathway | [+] 2 Pathwhiz Pathways | + | ||||
| 1 | Steroid Biosynthesis | |||||
| 2 | Bile Acid Biosynthesis | |||||
| WikiPathways | [+] 1 WikiPathways | + | ||||
| 1 | Phase I biotransformations, non P450 | |||||
| References | Top | |||||
|---|---|---|---|---|---|---|
| REF 1 | A Phase 3 Trial of Sebelipase Alfa in Lysosomal Acid Lipase Deficiency. N Engl J Med. 2015 Sep 10;373(11):1010-20. | |||||
| REF 2 | ClinicalTrials.gov (NCT01757184) A Multicenter Study of SBC-102 (Sebelipase Alfa) in Patients With Lysosomal Acid Lipase Deficiency/ ARISE (Acid Lipase Replacement Investigating Safety and Efficacy).U.S. National Institutes of Health. | |||||
If You Find Any Error in Data or Bug in Web Service, Please Kindly Report It to Dr. Zhou and Dr. Zhang.

