Target Information
| Target General Information | Top | |||||
|---|---|---|---|---|---|---|
| Target ID |
T09133
(Former ID: TTDI03353)
|
|||||
| Target Name |
LIM domain kinase-2 (LIMK-2)
|
|||||
| Synonyms |
LIMK-2; LIM domain kinase 2
Click to Show/Hide
|
|||||
| Gene Name |
LIMK2
|
|||||
| Target Type |
Literature-reported target
|
[1] | ||||
| Function |
Displays serine/threonine-specific phosphorylation of myelin basic protein and histone (MBP) in vitro.
Click to Show/Hide
|
|||||
| BioChemical Class |
Kinase
|
|||||
| UniProt ID | ||||||
| EC Number |
EC 2.7.11.1
|
|||||
| Sequence |
MSALAGEDVWRCPGCGDHIAPSQIWYRTVNETWHGSCFRCSECQDSLTNWYYEKDGKLYC
PKDYWGKFGEFCHGCSLLMTGPFMVAGEFKYHPECFACMSCKVIIEDGDAYALVQHATLY CGKCHNEVVLAPMFERLSTESVQEQLPYSVTLISMPATTEGRRGFSVSVESACSNYATTV QVKEVNRMHISPNNRNAIHPGDRILEINGTPVRTLRVEEVEDAISQTSQTLQLLIEHDPV SQRLDQLRLEARLAPHMQNAGHPHALSTLDTKENLEGTLRRRSLRRSNSISKSPGPSSPK EPLLFSRDISRSESLRCSSSYSQQIFRPCDLIHGEVLGKGFFGQAIKVTHKATGKVMVMK ELIRCDEETQKTFLTEVKVMRSLDHPNVLKFIGVLYKDKKLNLLTEYIEGGTLKDFLRSM DPFPWQQKVRFAKGIASGMAYLHSMCIIHRDLNSHNCLIKLDKTVVVADFGLSRLIVEER KRAPMEKATTKKRTLRKNDRKKRYTVVGNPYWMAPEMLNGKSYDETVDIFSFGIVLCEII GQVYADPDCLPRTLDFGLNVKLFWEKFVPTDCPPAFFPLAAICCRLEPESRPAFSKLEDS FEALSLYLGELGIPLPAELEELDHTVSMQYGLTRDSPP Click to Show/Hide
|
|||||
| 3D Structure | Click to Show 3D Structure of This Target | AlphaFold | ||||
| Cell-based Target Expression Variations | Top | |||||
|---|---|---|---|---|---|---|
| Cell-based Target Expression Variations | ||||||
| Drug Binding Sites of Target | Top | |||||
|---|---|---|---|---|---|---|
| Ligand Name: 2-(2-methylpropanoylamino)-~{N}-[2-[(phenylmethyl)-[4-(phenylsulfamoyl)phenyl]carbonyl-amino]ethyl]-1,3-thiazole-5-carboxamide | Ligand Info | |||||
| Structure Description | LIM domain kinase 2 (LIMK2) in complex with TH-470 | PDB:7QHG | ||||
| Method | X-ray diffraction | Resolution | 1.45 Å | Mutation | No | [3] |
| PDB Sequence |
MDLIHGEVLG
338 KGFFGQAIKV348 THKATGKVMV358 MKELIRCDEE368 TQKTFLTEVK378 VMRSLDHPNV 388 LKFIGVLYKD398 KKLNLLTEYI408 EGGTLKDFLR418 SMDPFPWQQK428 VRFAKGIASG 438 MAYLHSMCII448 HRDLNSHNCL458 IKLDKTVVVA468 DFGLSRLIVD499 RKKRYTVVGN 509 PYWMAPEMLN519 GKSYDETVDI529 FSFGIVLCEI539 IGQVYADPDC549 LPRTLDFGLN 559 VKLFWEKFVP569 TDCPPAFFPL579 AAICCRLEPE589 SRPAFSKLED599 SFEALSLYLG 609 ELGIPLPAEL619 EELDHTVSMQ629 YGL
|
|||||
|
|
LEU337
3.732
PHE342
4.918
VAL358
3.572
LYS360
3.518
GLU361
3.831
LEU362
4.208
MET380
3.115
LEU383
3.290
VAL388
3.589
LEU389
3.411
PHE391
3.390
LEU403
3.574
THR405
3.079
GLU406
3.364
TYR407
3.932
ILE408
2.773
|
|||||
| Ligand Name: 4-[(3-Chlorophenyl)sulfamoyl]-~{n}-(Phenylmethyl)-~{n}-Propyl-Benzamide | Ligand Info | |||||
| Structure Description | LIM Domain Kinase 2 (LIMK2) In Complex With TH-300 | PDB:5NXD | ||||
| Method | X-ray diffraction | Resolution | 1.90 Å | Mutation | No | [4] |
| PDB Sequence |
DLIHGEVLGK
339 GFFGQAIKVT349 HKATGKVMVM359 KELIRCDEET369 QKTFLTEVKV379 MRSLDHPNVL 389 KFIGVLYKDK399 KLNLLTEYIE409 GGTLKDFLRS419 MDPFPWQQKV429 RFAKGIASGM 439 AYLHSMCIIH449 RDLNSHNCLI459 KLDKTVVVAD469 FGLSRLIVPY511 WMAPEMLNGK 521 SYDETVDIFS531 FGIVLCEIIG541 QVYADPDCLP551 RTLDFGLNVK561 LFWEKFVPTD 571 CPPAFFPLAA581 ICCRLEPESR591 PAFSKLEDSF601 EALSLYLGEL611 GIPLPAELEE 621 LDHTVSMQYG631 L
|
|||||
|
|
LEU337
4.644
ALA345
4.462
VAL358
4.016
LYS360
3.546
GLU361
3.588
LEU362
4.217
MET380
3.179
LEU383
3.548
VAL388
3.549
LEU389
3.569
PHE391
3.274
LEU403
3.686
|
|||||
| Click to View More Binding Site Information of This Target with Different Ligands | ||||||
| Different Human System Profiles of Target | Top |
|---|---|
|
Human Similarity Proteins
of target is determined by comparing the sequence similarity of all human proteins with the target based on BLAST. The similarity proteins for a target are defined as the proteins with E-value < 0.005 and outside the protein families of the target.
A target that has fewer human similarity proteins outside its family is commonly regarded to possess a greater capacity to avoid undesired interactions and thus increase the possibility of finding successful drugs
(Brief Bioinform, 21: 649-662, 2020).
Human Tissue Distribution
of target is determined from a proteomics study that quantified more than 12,000 genes across 32 normal human tissues. Tissue Specificity (TS) score was used to define the enrichment of target across tissues.
The distribution of targets among different tissues or organs need to be taken into consideration when assessing the target druggability, as it is generally accepted that the wider the target distribution, the greater the concern over potential adverse effects
(Nat Rev Drug Discov, 20: 64-81, 2021).
Human Pathway Affiliation
of target is determined by the life-essential pathways provided on KEGG database. The target-affiliated pathways were defined based on the following two criteria (a) the pathways of the studied target should be life-essential for both healthy individuals and patients, and (b) the studied target should occupy an upstream position in the pathways and therefore had the ability to regulate biological function.
Targets involved in a fewer pathways have greater likelihood to be successfully developed, while those associated with more human pathways increase the chance of undesirable interferences with other human processes
(Pharmacol Rev, 58: 259-279, 2006).
Biological Network Descriptors
of target is determined based on a human protein-protein interactions (PPI) network consisting of 9,309 proteins and 52,713 PPIs, which were with a high confidence score of ≥ 0.95 collected from STRING database.
The network properties of targets based on protein-protein interactions (PPIs) have been widely adopted for the assessment of target’s druggability. Proteins with high node degree tend to have a high impact on network function through multiple interactions, while proteins with high betweenness centrality are regarded to be central for communication in interaction networks and regulate the flow of signaling information
(Front Pharmacol, 9, 1245, 2018;
Curr Opin Struct Biol. 44:134-142, 2017).
Human Similarity Proteins
Human Tissue Distribution
Human Pathway Affiliation
Biological Network Descriptors
|
|
|
Note:
If a protein has TS (tissue specficity) scores at least in one tissue >= 2.5, this protein is called tissue-enriched (including tissue-enriched-but-not-specific and tissue-specific). In the plots, the vertical lines are at thresholds 2.5 and 4.
|
| KEGG Pathway | Pathway ID | Affiliated Target | Pathway Map |
|---|---|---|---|
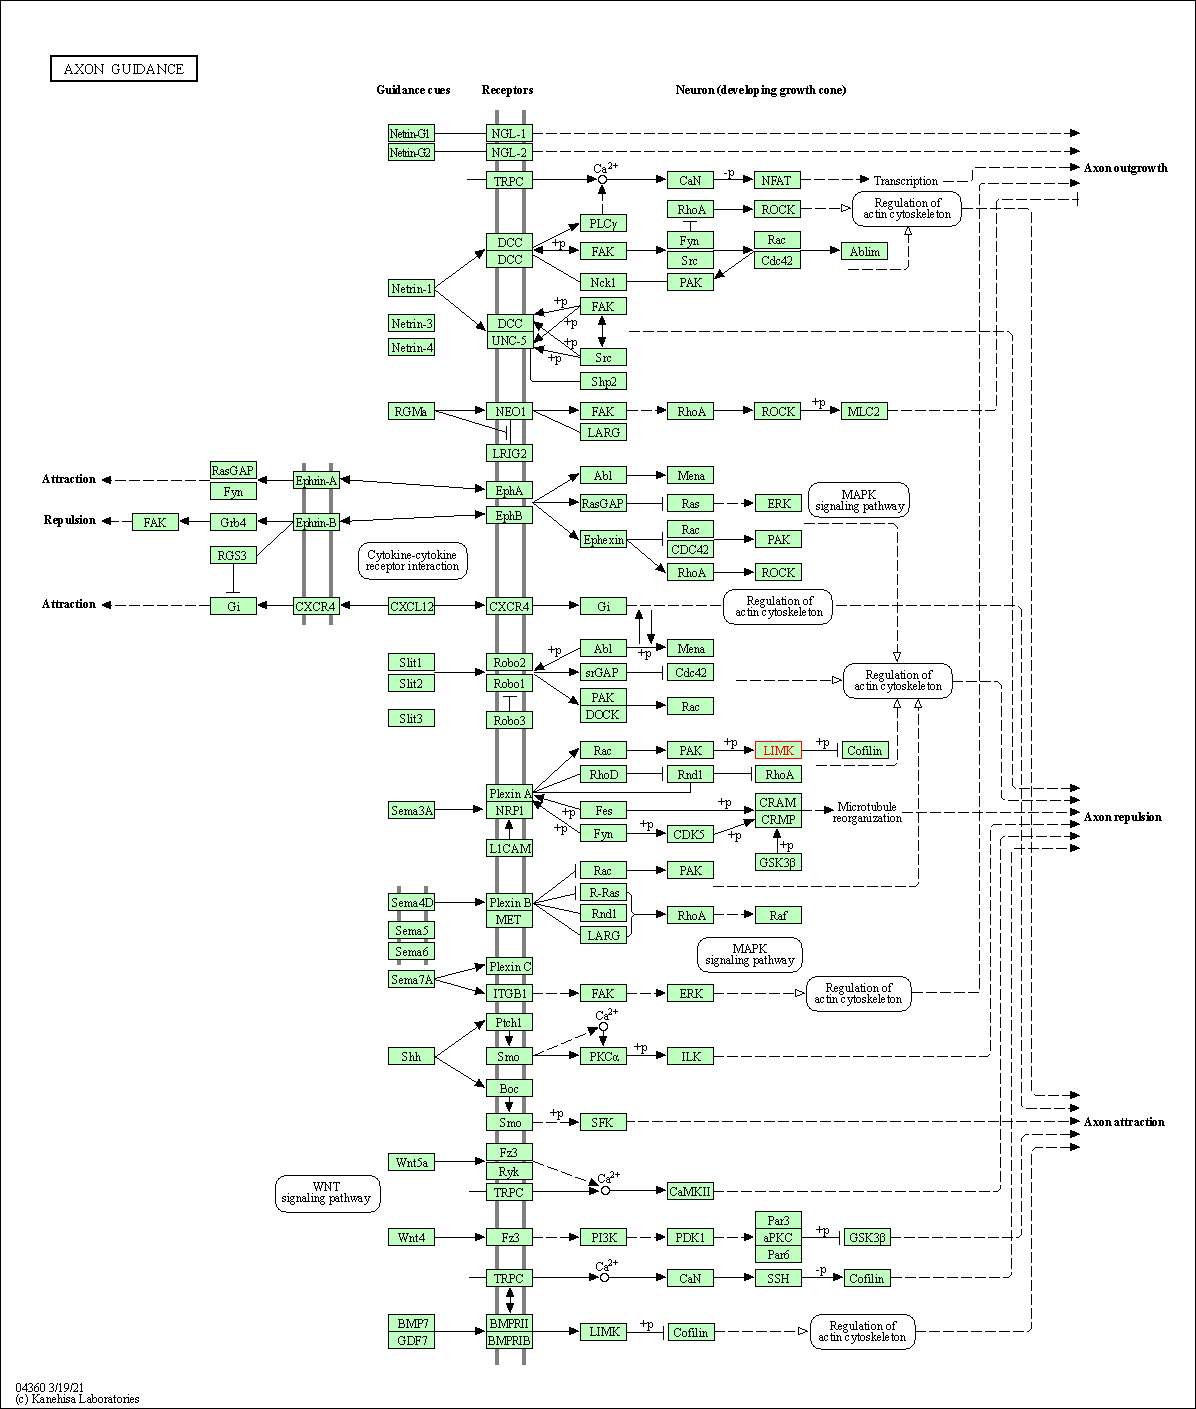
| Axon guidance | hsa04360 | Affiliated Target |

|
| Class: Organismal Systems => Development and regeneration | Pathway Hierarchy | ||
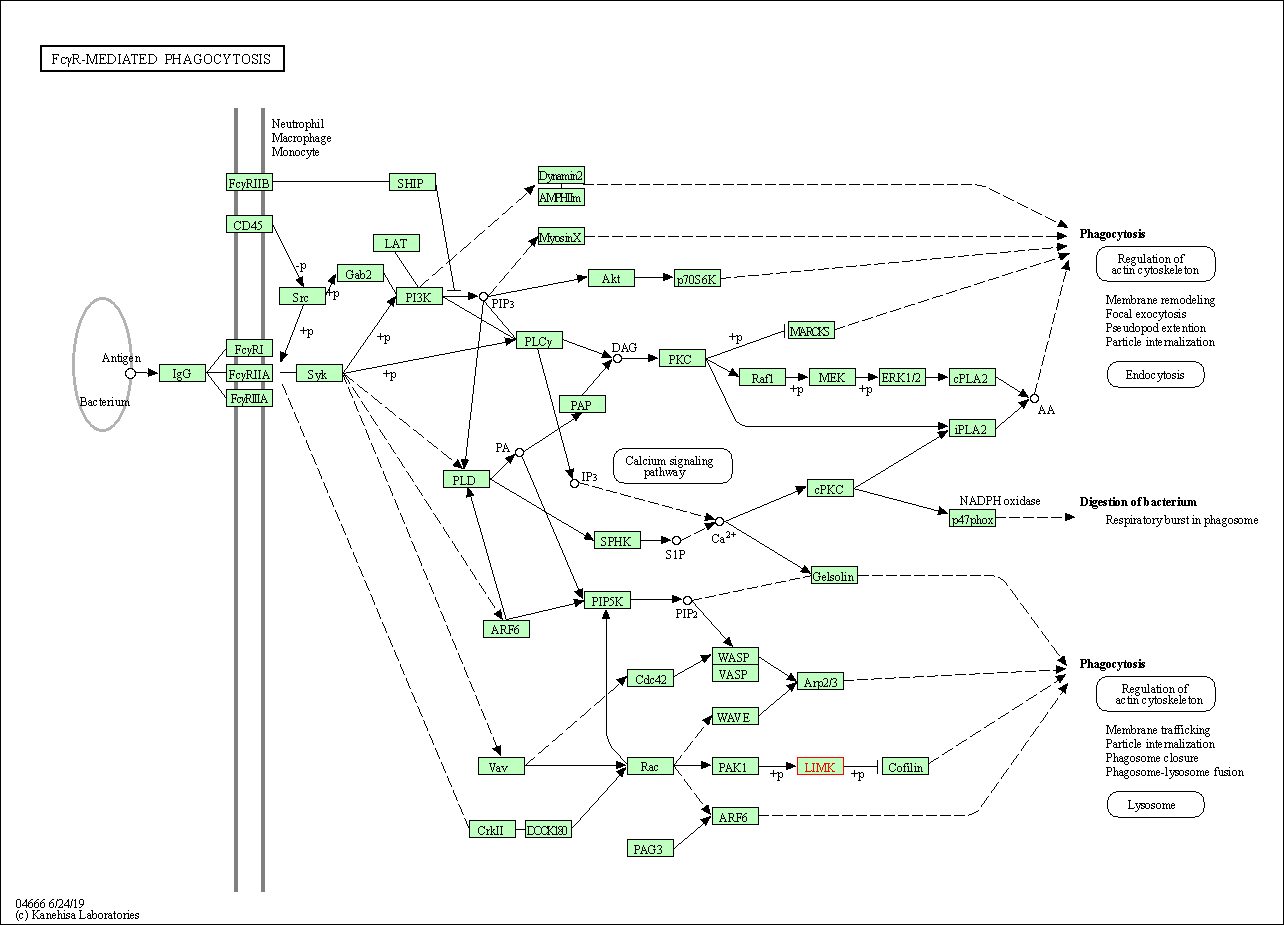
| Fc gamma R-mediated phagocytosis | hsa04666 | Affiliated Target |

|
| Class: Organismal Systems => Immune system | Pathway Hierarchy | ||
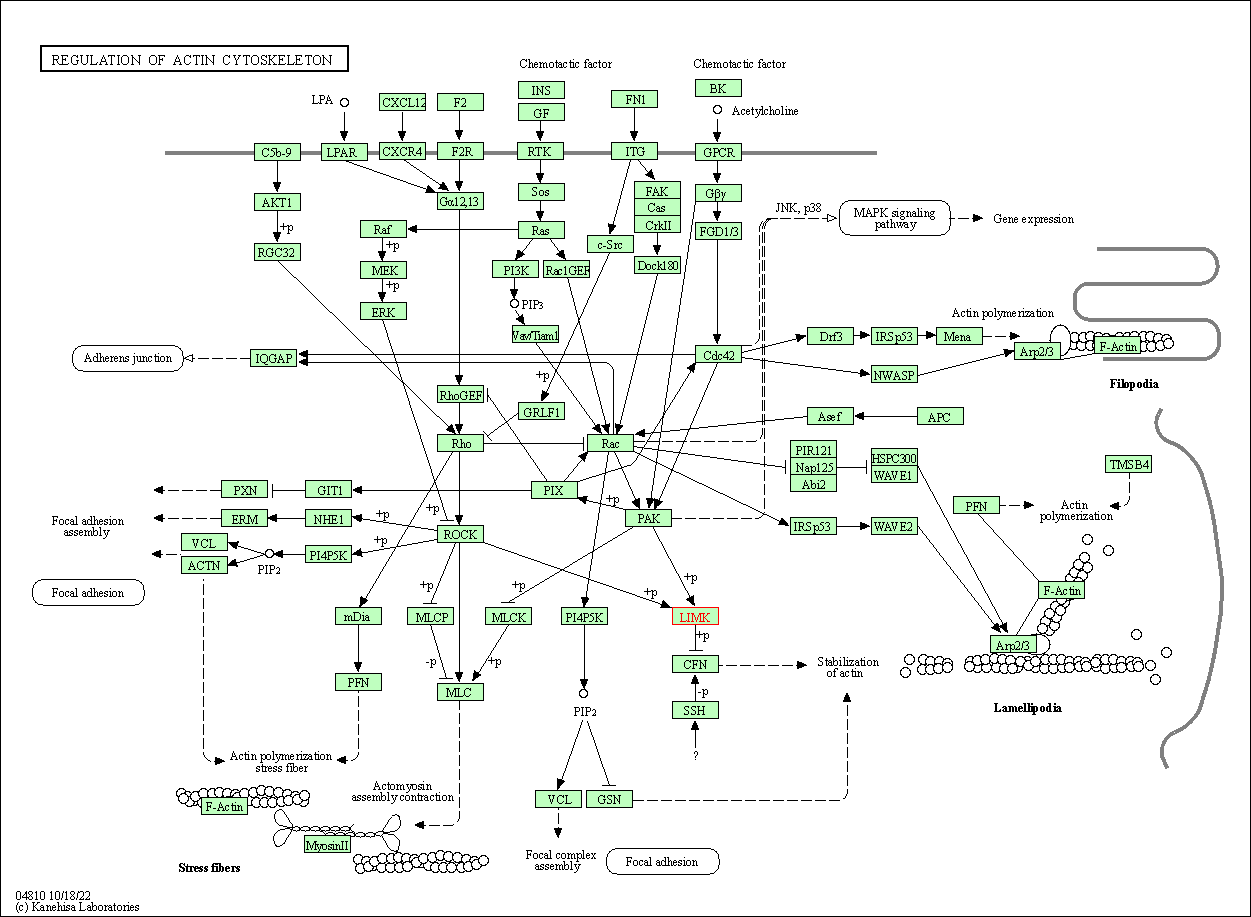
| Regulation of actin cytoskeleton | hsa04810 | Affiliated Target |

|
| Class: Cellular Processes => Cell motility | Pathway Hierarchy | ||
| Degree | 6 | Degree centrality | 6.45E-04 | Betweenness centrality | 1.55E-05 |
|---|---|---|---|---|---|
| Closeness centrality | 2.17E-01 | Radiality | 1.38E+01 | Clustering coefficient | 4.00E-01 |
| Neighborhood connectivity | 5.48E+01 | Topological coefficient | 2.30E-01 | Eccentricity | 12 |
| Download | Click to Download the Full PPI Network of This Target | ||||
| Chemical Structure based Activity Landscape of Target | Top |
|---|---|
| Drug Property Profile of Target | Top | |
|---|---|---|
| (1) Molecular Weight (mw) based Drug Clustering | (2) Octanol/Water Partition Coefficient (xlogp) based Drug Clustering | |
|
|
||
| (3) Hydrogen Bond Donor Count (hbonddonor) based Drug Clustering | (4) Hydrogen Bond Acceptor Count (hbondacc) based Drug Clustering | |
|
|
||
| (5) Rotatable Bond Count (rotbonds) based Drug Clustering | (6) Topological Polar Surface Area (polararea) based Drug Clustering | |
|
|
||
| "RO5" indicates the cutoff set by lipinski's rule of five; "D123AB" colored in GREEN denotes the no violation of any cutoff in lipinski's rule of five; "D123AB" colored in PURPLE refers to the violation of only one cutoff in lipinski's rule of five; "D123AB" colored in BLACK represents the violation of more than one cutoffs in lipinski's rule of five | ||
| Target Poor or Non Binders | Top | |||||
|---|---|---|---|---|---|---|
| Target Poor or Non Binders | ||||||
| References | Top | |||||
|---|---|---|---|---|---|---|
| REF 1 | Novel class of LIM-kinase 2 inhibitors for the treatment of ocular hypertension and associated glaucoma. J Med Chem. 2009 Nov 12;52(21):6515-8. | |||||
| REF 2 | Modulation of cofilin phosphorylation by inhibition of the Lim family kinases. Bioorg Med Chem Lett. 2012 Sep 15;22(18):5995-8. | |||||
| REF 3 | Development and Characterization of Type I, Type II, and Type III LIM-Kinase Chemical Probes. J Med Chem. 2022 Oct 13;65(19):13264-13287. | |||||
| REF 4 | LIM Domain Kinase 2 (LIMK2)In Complex With TH-300 | |||||
If You Find Any Error in Data or Bug in Web Service, Please Kindly Report It to Dr. Zhou and Dr. Zhang.

