

Target expression details
| Target General Information | |||||
|---|---|---|---|---|---|
| Target ID | T47101 | ||||
| Target Name | Fibroblast growth factor receptor 1 | ||||
| Synonyms | CD331 antigen; FGFR-1; Fms-like tyrosine kinase 2; bFGF-R; c-fgr; FGFR1 | ||||
| Target Type | Clinical Trial | ||||
| Gene Name | FGFR1 | ||||
| Biochemical Class | Kinase | ||||
| UniProt ID | FGFR1_HUMAN | ||||
| Target Gene Expression Profiles in the Disease-Relevant Drug Targeted Tissue of the Patients and Healthy Individuals | |||||
| Disease | Atopic dermatitis | ||||
| Example drug | AM-001 | Phase 2 | [1], [2] | ||
| Tissue | Skin | ||||
| Level of differential expression between the patients in the disease section of the tissue and the tissues of healthy individual | Fold-change: -0.12 Z-score: -0.72 P-value: 1.06E-01 |
||||
|
Target gene expression profiles of the patients in the disease section of the tissue
Target gene expression profiles in the tissue of healthy individual
|
|||||
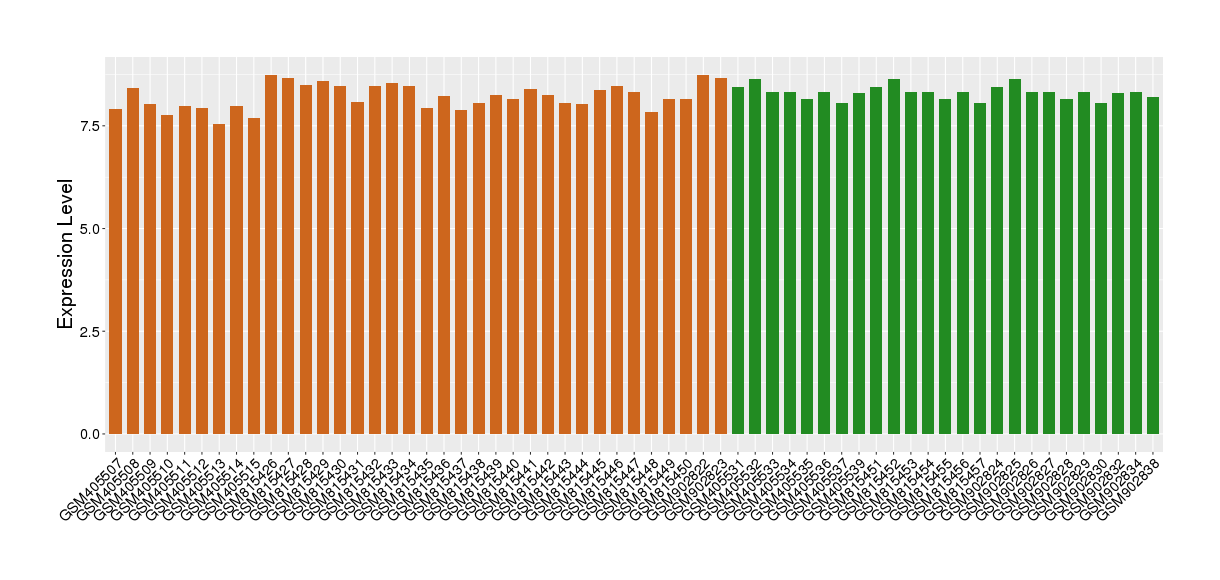
| Disease | Ovarian cancer | ||||
| Example drug | Nintedanib | Phase 2 | [3], [4], [5], [2] | ||
| Tissue | Ovarian tissue | ||||
| Level of differential expression between the patients in the disease section of the tissue and the tissues of healthy individual | Fold-change: -0.74 Z-score: -1.73 P-value: 3.31E-03 |
||||
| Level of differential expression between the patients in the disease section of the tissue and the patients in the normal section of the tissue adjacent to the disease section | Fold-change: 3.09E-04 Z-score: 1.35E-03 P-value: 1.25E-01 |
||||
|
Target gene expression profiles of the patients in the disease section of the tissue
Target gene expression profiles of the patients in the normal section of the tissue adjacent to the disease section
Target gene expression profiles in the tissue of healthy individual

|
|||||
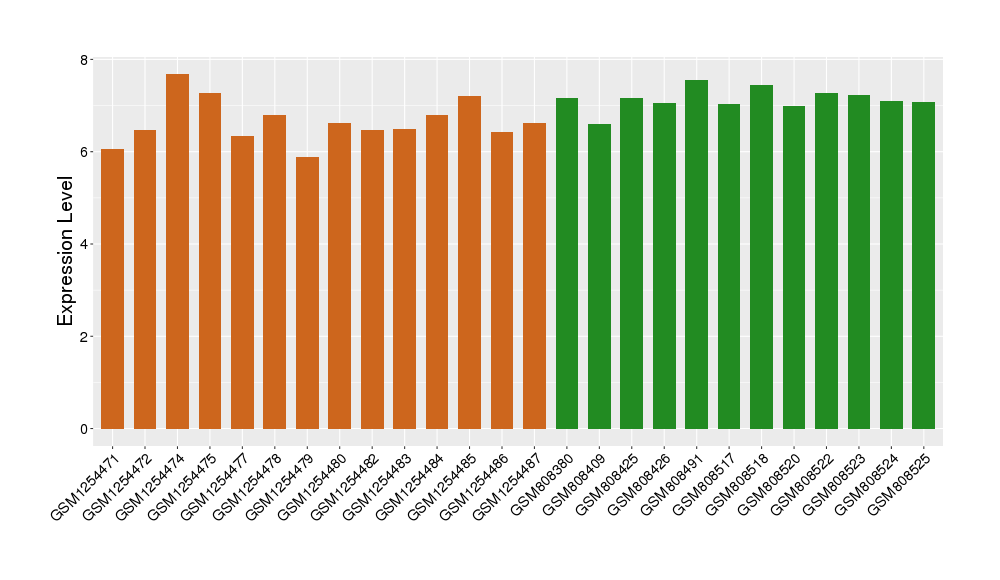
| Disease | Uterine cancer | ||||
| Example drug | FP-1039 | Phase 2 | [6], [2] | ||
| Tissue | Endometrium tissue | ||||
| Level of differential expression between the patients in the disease section of the tissue and the tissues of healthy individual | Fold-change: -0.20 Z-score: -0.38 P-value: 1.04E-02 |
||||
| Level of differential expression between the patients in the disease section of the tissue and the patients in the normal section of the tissue adjacent to the disease section | Fold-change: -0.50 Z-score: -2.14 P-value: 1.80E-02 |
||||
|
Target gene expression profiles of the patients in the disease section of the tissue
Target gene expression profiles of the patients in the normal section of the tissue adjacent to the disease section
Target gene expression profiles in the tissue of healthy individual

|
|||||
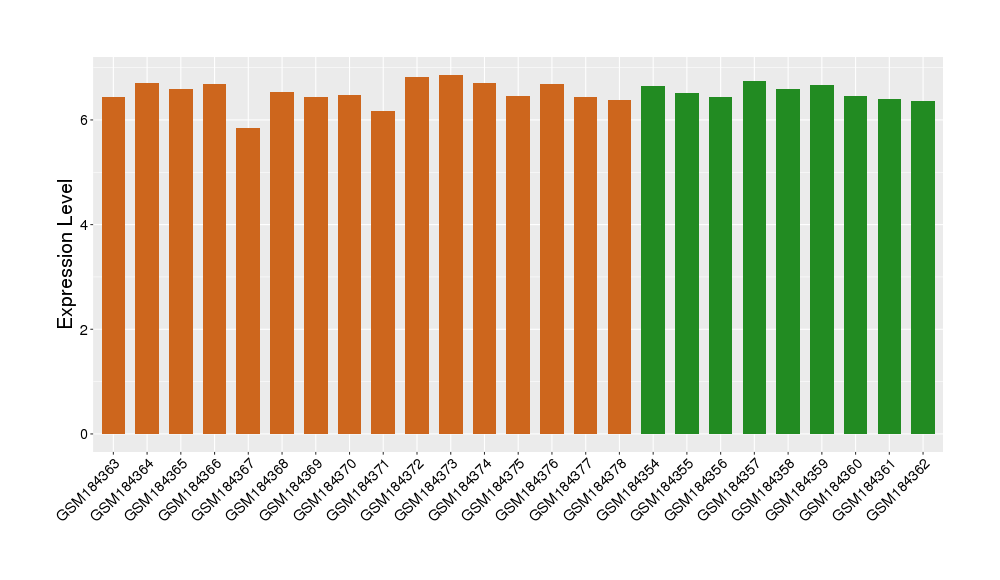
| Disease | Alzheimer's disease | ||||
| Example drug | MK-2461 | Phase 1/2 | [7], [2] | ||
| Tissue | Entorhinal cortex | ||||
| Level of differential expression between the patients in the disease section of the tissue and the tissues of healthy individual | Fold-change: -0.03 Z-score: -0.15 P-value: 4.79E-02 |
||||
|
Target gene expression profiles of the patients in the disease section of the tissue
Target gene expression profiles in the tissue of healthy individual

|
|||||
| Disease | Acute myelocytic leukemia | ||||
| Example drug | KW-2449 | Phase 1 | [8], [9], [2] | ||
| Tissue | Bone marrow | ||||
| Level of differential expression between the patients in the disease section of the tissue and the tissues of healthy individual | Fold-change: 1.24E-03 Z-score: 4.64E-03 P-value: 5.16E-02 |
||||
|
Target gene expression profiles of the patients in the disease section of the tissue
Target gene expression profiles in the tissue of healthy individual

|
|||||
| Disease | Retinoblastoma tumor | ||||
| Example drug | PD-0183812 | Terminated | [10], [2] | ||
| Tissue | Uvea | ||||
| Level of differential expression between the patients in the disease section of the tissue and the tissues of healthy individual | Fold-change: -0.58 Z-score: -2.40 P-value: 3.33E-03 |
||||
|
Target gene expression profiles of the patients in the disease section of the tissue
Target gene expression profiles in the tissue of healthy individual
|
|||||
| Disease | Liver cancer | ||||
| Tissue | Liver tissue | ||||
| Level of differential expression between the patients in the disease section of the tissue and the tissues of healthy individual | Fold-change: -0.12 Z-score: -0.59 P-value: 1.18E-03 |
||||
| Level of differential expression between the patients in the disease section of the tissue and the patients in the normal section of the tissue adjacent to the disease section | Fold-change: -0.08 Z-score: -0.28 P-value: 3.61E-03 |
||||
|
Target gene expression profiles of the patients in the disease section of the tissue
Target gene expression profiles of the patients in the normal section of the tissue adjacent to the disease section
Target gene expression profiles in the tissue of the persons with other diseases not directly affecting the tissue
Target gene expression profiles in the tissue of healthy individual

|
|||||
| Disease | Parkinson's disease | ||||
| Tissue | Substantia nigra tissue | ||||
| Level of differential expression between the patients in the disease section of the tissue and the tissues of healthy individual | Fold-change: -0.02 Z-score: -0.16 P-value: 7.85E-01 |
||||
|
Target gene expression profiles of the patients in the disease section of the tissue
Target gene expression profiles in the tissue of healthy individual
|
|||||
| Disease | Renal cancer | ||||
| Tissue | Kidney | ||||
| Level of differential expression between the patients in the disease section of the tissue and the tissues of healthy individual | Fold-change: 0.07 Z-score: 0.28 P-value: 2.92E-01 |
||||
| Level of differential expression between the patients in the disease section of the tissue and the patients in the normal section of the tissue adjacent to the disease section | Fold-change: 0.09 Z-score: 0.22 P-value: 1.99E-03 |
||||
|
Target gene expression profiles of the patients in the disease section of the tissue
Target gene expression profiles of the patients in the normal section of the tissue adjacent to the disease section
Target gene expression profiles in the tissue of healthy individual

|
|||||
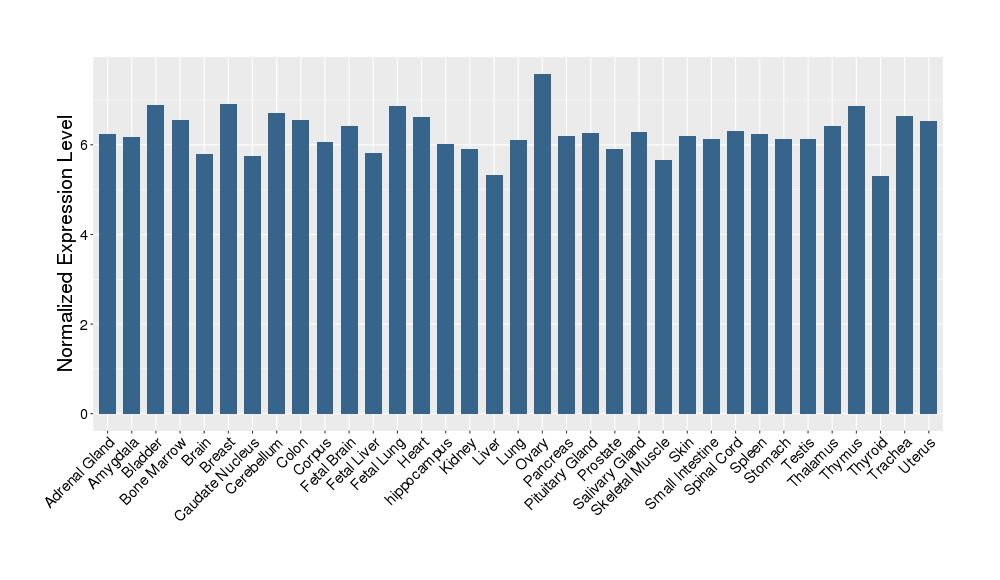
| Target Gene Expression Profiles in Other Tissues of Healthy Individuals | |||||
|
|||||
| Reference | |||||
| REF 1 | ClinicalTrials.gov (NCT01938599) Study Comparing AM001 Cream to Vehicle in the Treatment of Plaque Psoriasis. U.S. National Institutes of Health. | ||||
| REF 3 | ClinicalTrials.gov (NCT01979952) Nintedanib Twice Daily vs Placebo in Patients Diagnosed With Idiopathic Pulmonary Fibrosis (IPF). U.S. National Institutes of Health. | ||||
| REF 4 | ClinicalTrials.gov (NCT02231164) LUME-Columbus: Nintedanib Plus Docetaxel in Advanced Non-small Cell Lung Cancer With Translational Research. U.S. National Institutes of Health. | ||||
| REF 5 | (http://www.guidetopharmacology.org/) Nucleic Acids Res. 2015 Oct 12. pii: gkv1037. The IUPHAR/BPS Guide to PHARMACOLOGY in 2016: towards curated quantitative interactions between 1300 protein targets and 6000 ligands. (Ligand id: 5936). | ||||
| REF 6 | ClinicalTrials.gov (NCT01244438) Study of FP-1039 in Subjects With Endometrial Cancers. U.S. National Institutes of Health. | ||||
| REF 7 | MK-2461, a novel multitargeted kinase inhibitor, preferentially inhibits the activated c-Met receptor. Cancer Res. 2010 Feb 15;70(4):1524-33. | ||||
| REF 8 | KW-2449, a novel multikinase inhibitor, suppresses the growth of leukemia cells with FLT3 mutations or T315I-mutated BCR/ABL translocation. Blood. 2009 Aug 20;114(8):1607-17. | ||||
| REF 9 | (http://www.guidetopharmacology.org/) Nucleic Acids Res. 2015 Oct 12. pii: gkv1037. The IUPHAR/BPS Guide to PHARMACOLOGY in 2016: towards curated quantitative interactions between 1300 protein targets and 6000 ligands. (Ligand id: 5691). | ||||
| REF 10 | Trusted, scientifically sound profiles of drug programs, clinical trials, safety reports, and company deals, written by scientists. Springer. 2015. Adis Insight (drug id 800014130) | ||||
If You Find Any Error in Data or Bug in Web Service, Please Kindly Report It to Dr. Zhou and Dr. Zhang.