Target Information
| Target General Information | Top | |||||
|---|---|---|---|---|---|---|
| Target ID |
T92439
(Former ID: TTDI03444)
|
|||||
| Target Name |
Phosphodiesterase 1C (PDE1C)
|
|||||
| Synonyms |
Hcam3; Cam-PDE 1C; Calcium/calmodulin-dependent 3',5'-cyclic nucleotide phosphodiesterase 1C; 3',5'-cyclic-GMP phosphodiesterase; 3',5'-cyclic-AMP phosphodiesterase
Click to Show/Hide
|
|||||
| Gene Name |
PDE1C
|
|||||
| Target Type |
Literature-reported target
|
[1] | ||||
| Function |
Has a high affinity for both cAMP and cGMP. Modulates the amplitude and duration of the cAMP signal in sensory cilia in response to odorant stimulation, hence contributing to the generation of action potentials. Regulates smooth muscle cell proliferation. Regulates the stability of growth factor receptors, including PDGFRB. Calmodulin-dependent cyclic nucleotide phosphodiesterase with a dual-specificity for the second messengers cAMP and cGMP, which are key regulators of many important physiological processes.
Click to Show/Hide
|
|||||
| BioChemical Class |
Phosphoric diester hydrolase
|
|||||
| UniProt ID | ||||||
| EC Number |
EC 3.1.4.-
|
|||||
| Sequence |
MESPTKEIEEFESNSLKYLQPEQIEKIWLRLRGLRKYKKTSQRLRSLVKQLERGEASVVD
LKKNLEYAATVLESVYIDETRRLLDTEDELSDIQSDAVPSEVRDWLASTFTRQMGMMLRR SDEKPRFKSIVHAVQAGIFVERMYRRTSNMVGLSYPPAVIEALKDVDKWSFDVFSLNEAS GDHALKFIFYELLTRYDLISRFKIPISALVSFVEALEVGYSKHKNPYHNLMHAADVTQTV HYLLYKTGVANWLTELEIFAIIFSAAIHDYEHTGTTNNFHIQTRSDPAILYNDRSVLENH HLSAAYRLLQDDEEMNILINLSKDDWREFRTLVIEMVMATDMSCHFQQIKAMKTALQQPE AIEKPKALSLMLHTADISHPAKAWDLHHRWTMSLLEEFFRQGDREAELGLPFSPLCDRKS TMVAQSQVGFIDFIVEPTFTVLTDMTEKIVSPLIDETSQTGGTGQRRSSLNSISSSDAKR SGVKTSGSEGSAPINNSVISVDYKSFKATWTEVVHINRERWRAKVPKEEKAKKEAEEKAR LAAEEQQKEMEAKSQAEEGASGKAEKKTSGETKNQVNGTRANKSDNPRGKNSKAEKSSGE QQQNGDFKDGKNKTDKKDHSNIGNDSKKTDGTKQRSHGSPAPSTSSTCRLTLPVIKPPLR HFKRPAYASSSYAPSVSKKTDEHPARYKMLDQRIKMKKIQNISHNWNRK Click to Show/Hide
|
|||||
| 3D Structure | Click to Show 3D Structure of This Target | AlphaFold | ||||
| Cell-based Target Expression Variations | Top | |||||
|---|---|---|---|---|---|---|
| Cell-based Target Expression Variations | ||||||
| Different Human System Profiles of Target | Top |
|---|---|
|
Human Similarity Proteins
of target is determined by comparing the sequence similarity of all human proteins with the target based on BLAST. The similarity proteins for a target are defined as the proteins with E-value < 0.005 and outside the protein families of the target.
A target that has fewer human similarity proteins outside its family is commonly regarded to possess a greater capacity to avoid undesired interactions and thus increase the possibility of finding successful drugs
(Brief Bioinform, 21: 649-662, 2020).
Human Tissue Distribution
of target is determined from a proteomics study that quantified more than 12,000 genes across 32 normal human tissues. Tissue Specificity (TS) score was used to define the enrichment of target across tissues.
The distribution of targets among different tissues or organs need to be taken into consideration when assessing the target druggability, as it is generally accepted that the wider the target distribution, the greater the concern over potential adverse effects
(Nat Rev Drug Discov, 20: 64-81, 2021).
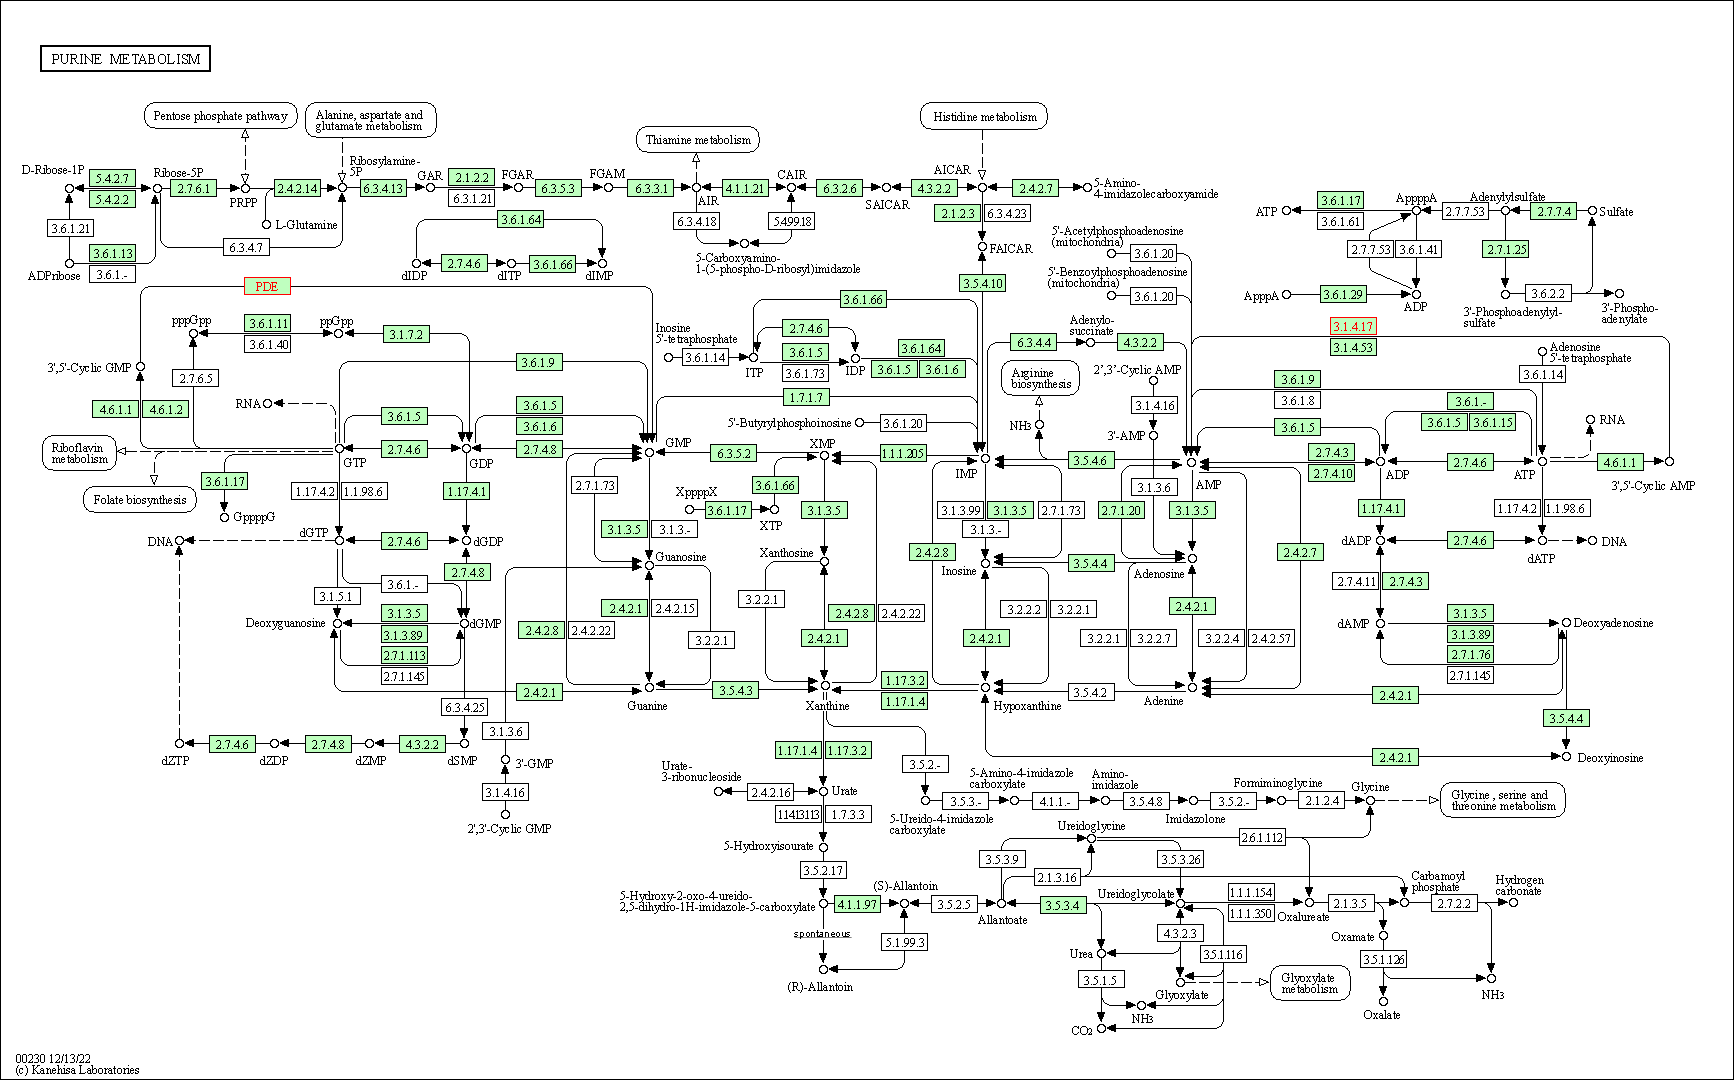
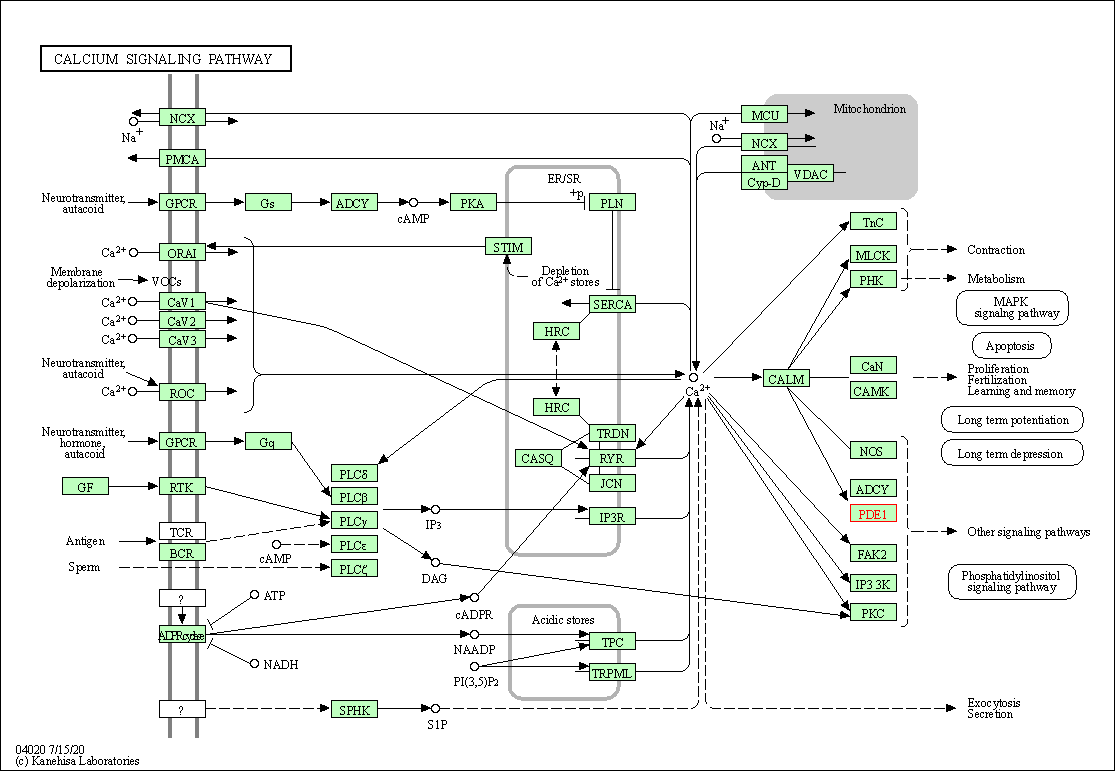
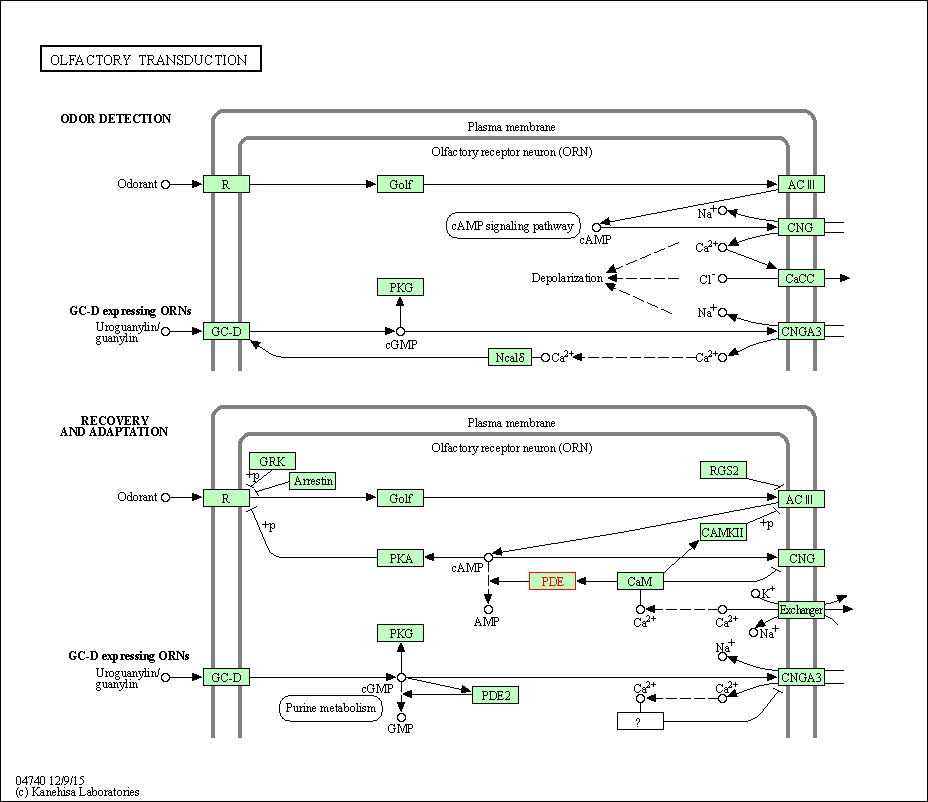
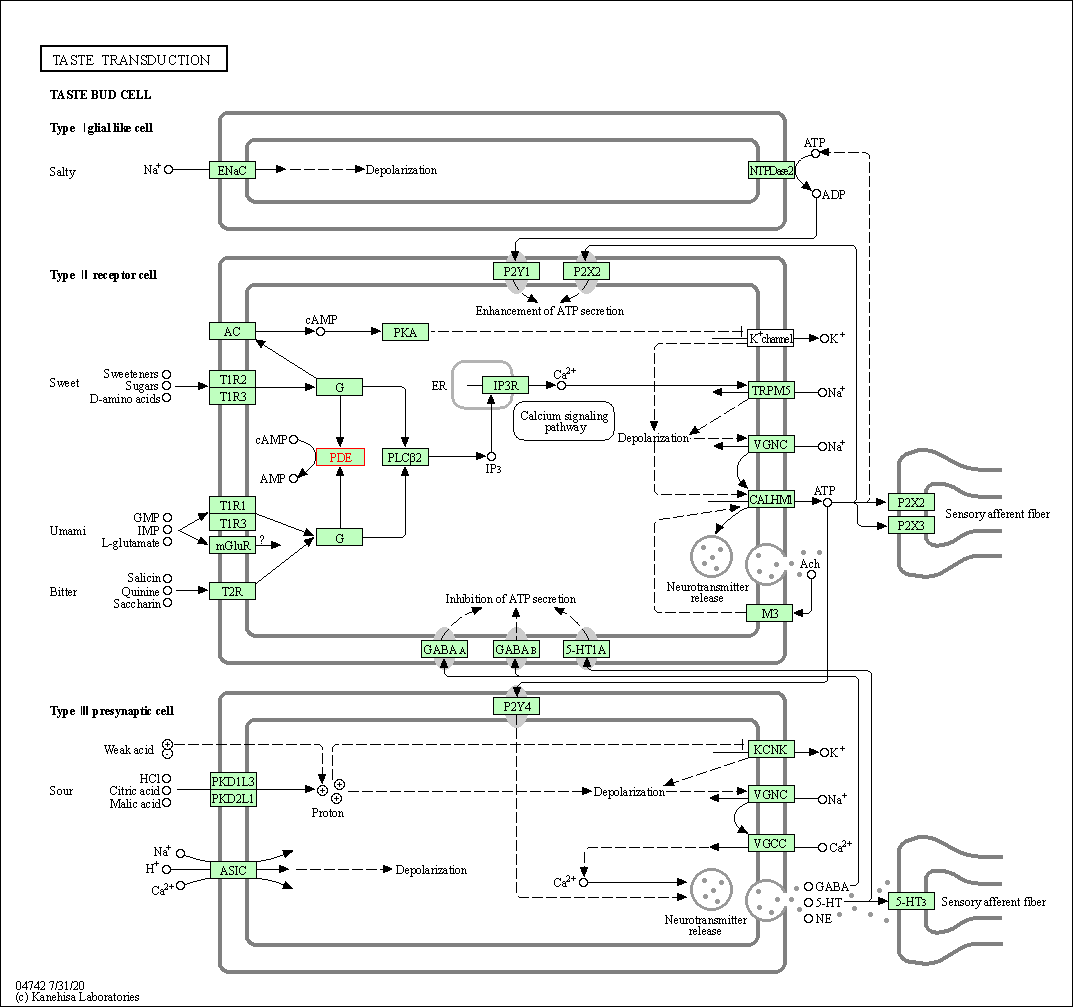
Human Pathway Affiliation
of target is determined by the life-essential pathways provided on KEGG database. The target-affiliated pathways were defined based on the following two criteria (a) the pathways of the studied target should be life-essential for both healthy individuals and patients, and (b) the studied target should occupy an upstream position in the pathways and therefore had the ability to regulate biological function.
Targets involved in a fewer pathways have greater likelihood to be successfully developed, while those associated with more human pathways increase the chance of undesirable interferences with other human processes
(Pharmacol Rev, 58: 259-279, 2006).
Human Similarity Proteins
Human Tissue Distribution
Human Pathway Affiliation
|
|
|
There is no similarity protein (E value < 0.005) for this target
|
|
Note:
If a protein has TS (tissue specficity) scores at least in one tissue >= 2.5, this protein is called tissue-enriched (including tissue-enriched-but-not-specific and tissue-specific). In the plots, the vertical lines are at thresholds 2.5 and 4.
|
| KEGG Pathway | Pathway ID | Affiliated Target | Pathway Map |
|---|---|---|---|
| Purine metabolism | hsa00230 | Affiliated Target |
|
| Class: Metabolism => Nucleotide metabolism | Pathway Hierarchy | ||
| Calcium signaling pathway | hsa04020 | Affiliated Target |
|
| Class: Environmental Information Processing => Signal transduction | Pathway Hierarchy | ||
| Olfactory transduction | hsa04740 | Affiliated Target |
|
| Class: Organismal Systems => Sensory system | Pathway Hierarchy | ||
| Taste transduction | hsa04742 | Affiliated Target |
|
| Class: Organismal Systems => Sensory system | Pathway Hierarchy | ||
| Renin secretion | hsa04924 | Affiliated Target |
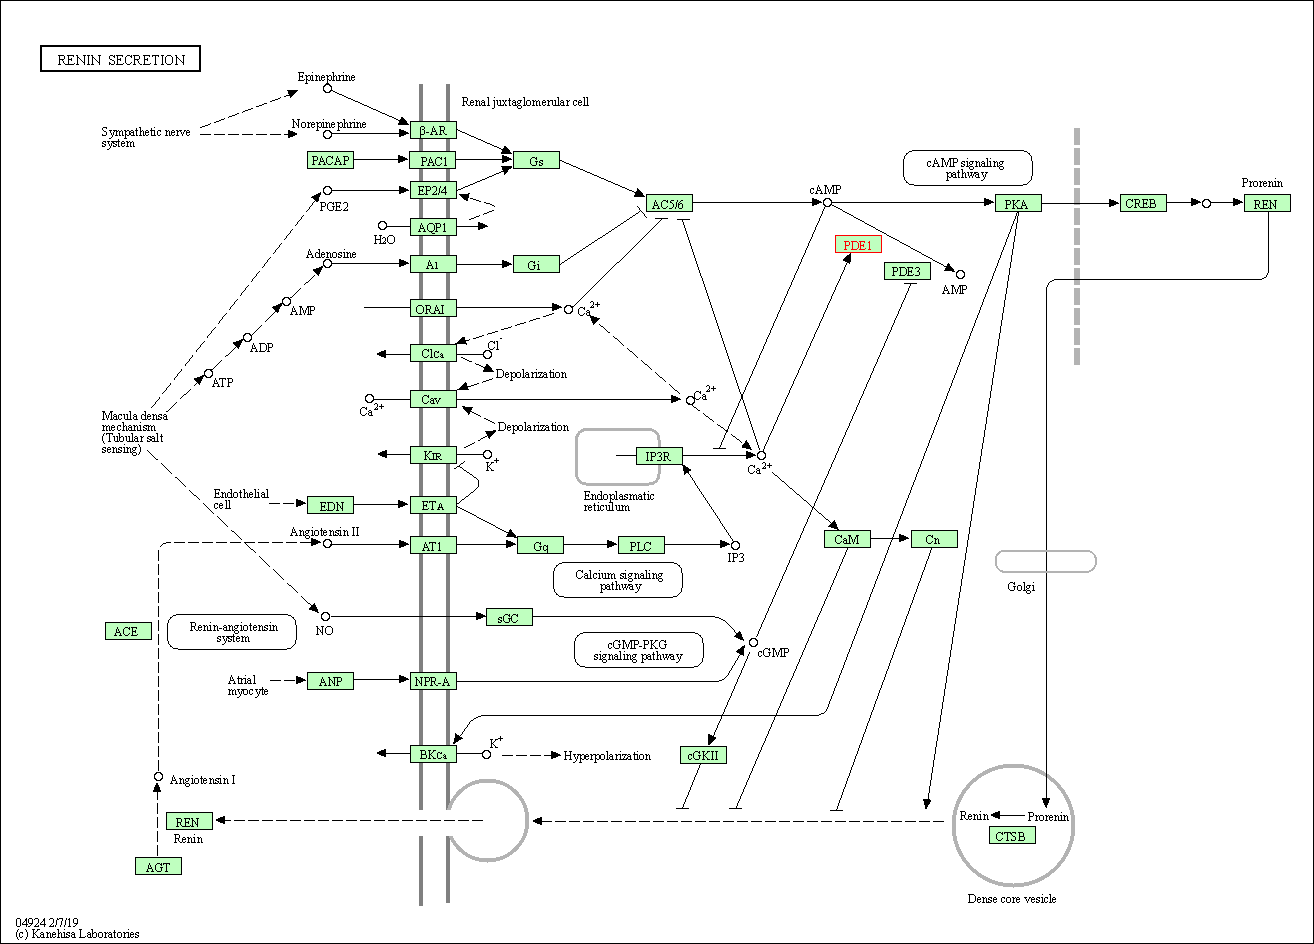
|
| Class: Organismal Systems => Endocrine system | Pathway Hierarchy | ||
| Chemical Structure based Activity Landscape of Target | Top |
|---|---|
| References | Top | |||||
|---|---|---|---|---|---|---|
| REF 1 | Antiplatelet and antiproliferative effects of SCH 51866, a novel type 1 and type 5 phosphodiesterase inhibitor. J Cardiovasc Pharmacol. 1996 Dec;28(6):862-9. | |||||
If You Find Any Error in Data or Bug in Web Service, Please Kindly Report It to Dr. Zhou and Dr. Zhang.

