Target Information
| Target General Information | Top | |||||
|---|---|---|---|---|---|---|
| Target ID |
T69091
(Former ID: TTDI03435)
|
|||||
| Target Name |
P2X purinoceptor 1 (P2RX1)
|
|||||
| Synonyms |
Purinergic receptor 1; P2X1
Click to Show/Hide
|
|||||
| Gene Name |
P2RX1
|
|||||
| Target Type |
Literature-reported target
|
[1] | ||||
| Function |
Ligand-gated ion channel with relatively high calcium permeability. Binding to ATP mediates synaptic transmission between neurons and from neurons to smooth muscle. Seems to be linked to apoptosis, by increasing the intracellular concentration of calcium in the presence of ATP, leading to programmed cell death (By similarity).
Click to Show/Hide
|
|||||
| UniProt ID | ||||||
| Sequence |
MARRFQEELAAFLFEYDTPRMVLVRNKKVGVIFRLIQLVVLVYVIGWVFLYEKGYQTSSG
LISSVSVKLKGLAVTQLPGLGPQVWDVADYVFPAQGDNSFVVMTNFIVTPKQTQGYCAEH PEGGICKEDSGCTPGKAKRKAQGIRTGKCVAFNDTVKTCEIFGWCPVEVDDDIPRPALLR EAENFTLFIKNSISFPRFKVNRRNLVEEVNAAHMKTCLFHKTLHPLCPVFQLGYVVQESG QNFSTLAEKGGVVGITIDWHCDLDWHVRHCRPIYEFHGLYEEKNLSPGFNFRFARHFVEN GTNYRHLFKVFGIRFDILVDGKAGKFDIIPTMTTIGSGIGIFGVATVLCDLLLLHILPKR HYYKQKKFKYAEDMGPGAAERDLAATSSTLGLQENMRTS Click to Show/Hide
|
|||||
| 3D Structure | Click to Show 3D Structure of This Target | AlphaFold | ||||
| Cell-based Target Expression Variations | Top | |||||
|---|---|---|---|---|---|---|
| Cell-based Target Expression Variations | ||||||
| Different Human System Profiles of Target | Top |
|---|---|
|
Human Similarity Proteins
of target is determined by comparing the sequence similarity of all human proteins with the target based on BLAST. The similarity proteins for a target are defined as the proteins with E-value < 0.005 and outside the protein families of the target.
A target that has fewer human similarity proteins outside its family is commonly regarded to possess a greater capacity to avoid undesired interactions and thus increase the possibility of finding successful drugs
(Brief Bioinform, 21: 649-662, 2020).
Human Tissue Distribution
of target is determined from a proteomics study that quantified more than 12,000 genes across 32 normal human tissues. Tissue Specificity (TS) score was used to define the enrichment of target across tissues.
The distribution of targets among different tissues or organs need to be taken into consideration when assessing the target druggability, as it is generally accepted that the wider the target distribution, the greater the concern over potential adverse effects
(Nat Rev Drug Discov, 20: 64-81, 2021).
Human Pathway Affiliation
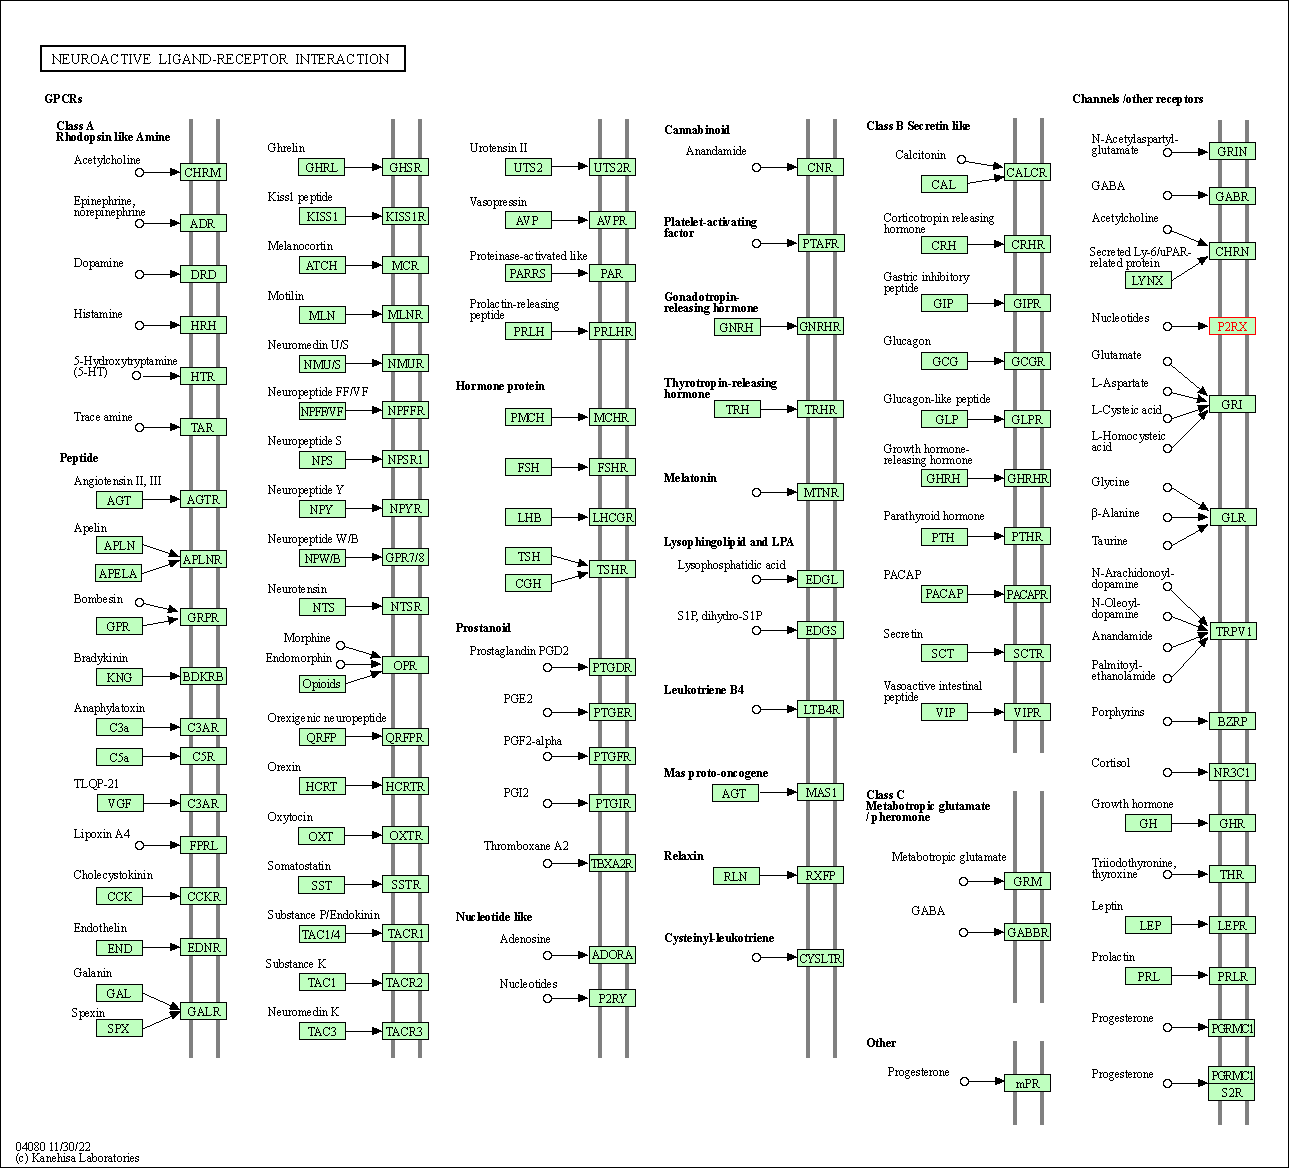
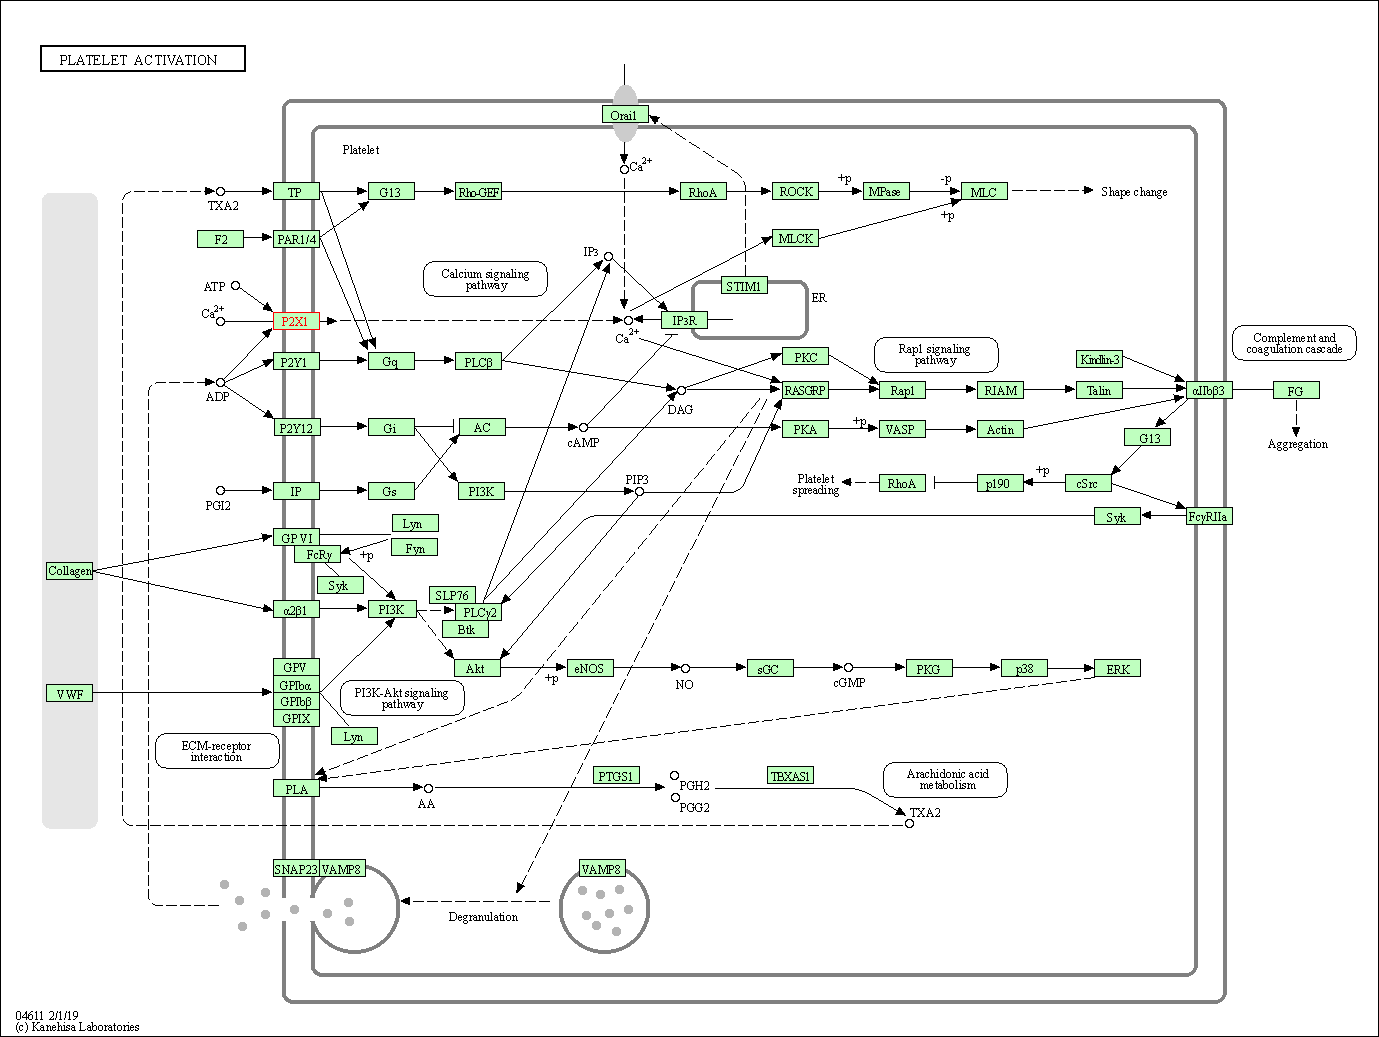
of target is determined by the life-essential pathways provided on KEGG database. The target-affiliated pathways were defined based on the following two criteria (a) the pathways of the studied target should be life-essential for both healthy individuals and patients, and (b) the studied target should occupy an upstream position in the pathways and therefore had the ability to regulate biological function.
Targets involved in a fewer pathways have greater likelihood to be successfully developed, while those associated with more human pathways increase the chance of undesirable interferences with other human processes
(Pharmacol Rev, 58: 259-279, 2006).
Human Similarity Proteins
Human Tissue Distribution
Human Pathway Affiliation
|
|
|
There is no similarity protein (E value < 0.005) for this target
|
|
Note:
If a protein has TS (tissue specficity) scores at least in one tissue >= 2.5, this protein is called tissue-enriched (including tissue-enriched-but-not-specific and tissue-specific). In the plots, the vertical lines are at thresholds 2.5 and 4.
|


| KEGG Pathway | Pathway ID | Affiliated Target | Pathway Map |
|---|---|---|---|
| Calcium signaling pathway | hsa04020 | Affiliated Target |

|
| Class: Environmental Information Processing => Signal transduction | Pathway Hierarchy | ||
| Neuroactive ligand-receptor interaction | hsa04080 | Affiliated Target |

|
| Class: Environmental Information Processing => Signaling molecules and interaction | Pathway Hierarchy | ||
| Platelet activation | hsa04611 | Affiliated Target |

|
| Class: Organismal Systems => Immune system | Pathway Hierarchy | ||
| Chemical Structure based Activity Landscape of Target | Top |
|---|---|
| Drug Property Profile of Target | Top | |
|---|---|---|
| (1) Molecular Weight (mw) based Drug Clustering | (2) Octanol/Water Partition Coefficient (xlogp) based Drug Clustering | |
|
|
||
| (3) Hydrogen Bond Donor Count (hbonddonor) based Drug Clustering | (4) Hydrogen Bond Acceptor Count (hbondacc) based Drug Clustering | |
|
|
||
| (5) Rotatable Bond Count (rotbonds) based Drug Clustering | (6) Topological Polar Surface Area (polararea) based Drug Clustering | |
|
|
||
| "RO5" indicates the cutoff set by lipinski's rule of five; "D123AB" colored in GREEN denotes the no violation of any cutoff in lipinski's rule of five; "D123AB" colored in PURPLE refers to the violation of only one cutoff in lipinski's rule of five; "D123AB" colored in BLACK represents the violation of more than one cutoffs in lipinski's rule of five | ||
| Target Poor or Non Binders | Top | |||||
|---|---|---|---|---|---|---|
| Target Poor or Non Binders | ||||||
| References | Top | |||||
|---|---|---|---|---|---|---|
| REF 1 | A pyridoxine cyclic phosphate and its 6-azoaryl derivative selectively potentiate and antagonize activation of P2X1 receptors. J Med Chem. 1998 Jun 18;41(13):2201-6. | |||||
| REF 2 | URL: http://www.guidetopharmacology.org Nucleic Acids Res. 2015 Oct 12. pii: gkv1037. The IUPHAR/BPS Guide to PHARMACOLOGY in 2016: towards curated quantitative interactions between 1300 protein targets and 6000 ligands. (Target id: 478). | |||||
| REF 3 | Structure-activity relationships of analogues of NF449 confirm NF449 as the most potent and selective known P2X1 receptor antagonist. Eur J Med Chem. 2004 Apr;39(4):345-57. | |||||
| REF 4 | Trinitrophenyl-substituted nucleotides are potent antagonists selective for P2X1, P2X3, and heteromeric P2X2/3 receptors. Mol Pharmacol. 1998 Jun;53(6):969-73. | |||||
If You Find Any Error in Data or Bug in Web Service, Please Kindly Report It to Dr. Zhou and Dr. Zhang.

