Target Information
| Target General Information | Top | |||||
|---|---|---|---|---|---|---|
| Target ID |
T34389
|
|||||
| Target Name |
Fatty-acid amide hydrolase 1 (FAAH1)
|
|||||
| Synonyms |
Oleamide hydrolase 1 of mouse; Oleamide hydrolase 1; FAAH; Anandamide amidohydrolase 1 of mouse; Anandamide amidohydrolase 1
Click to Show/Hide
|
|||||
| Gene Name |
FAAH1
|
|||||
| Target Type |
Patented-recorded target
|
[1] | ||||
| Function |
Hydrolyzes polyunsaturated substrate anandamide preferentially as compared to monounsaturated substrates. Degrades bioactive fatty acid amides like oleamide, the endogenous cannabinoid, anandamide and myristic amide to their corresponding acids, thereby serving to terminate the signaling functions of these molecules.
Click to Show/Hide
|
|||||
| BioChemical Class |
Carbon-nitrogen hydrolase
|
|||||
| UniProt ID | ||||||
| EC Number |
EC 3.5.1.99
|
|||||
| Sequence |
MVQYELWAALPGASGVALACCFVAAAVALRWSGRRTARGAVVRARQRQRAGLENMDRAAQ
RFRLQNPDLDSEALLALPLPQLVQKLHSRELAPEAVLFTYVGKAWEVNKGTNCVTSYLAD CETQLSQAPRQGLLYGVPVSLKECFTYKGQDSTLGLSLNEGVPAECDSVVVHVLKLQGAV PFVHTNVPQSMFSYDCSNPLFGQTVNPWKSSKSPGGSSGGEGALIGSGGSPLGLGTDIGG SIRFPSSFCGICGLKPTGNRLSKSGLKGCVYGQEAVRLSVGPMARDVESLALCLRALLCE DMFRLDPTVPPLPFREEVYTSSQPLRVGYYETDNYTMPSPAMRRAVLETKQSLEAAGHTL VPFLPSNIPHALETLSTGGLFSDGGHTFLQNFKGDFVDPCLGDLVSILKLPQWLKGLLAF LVKPLLPRLSAFLSNMKSRSAGKLWELQHEIEVYRKTVIAQWRALDLDVVLTPMLAPALD LNAPGRATGAVSYTMLYNCLDFPAGVVPVTTVTAEDEAQMEHYRGYFGDIWDKMLQKGMK KSVGLPVAVQCVALPWQEELCLRFMREVERLMTPEKQSS Click to Show/Hide
|
|||||
| HIT2.0 ID | T66NVP | |||||
| Cell-based Target Expression Variations | Top | |||||
|---|---|---|---|---|---|---|
| Cell-based Target Expression Variations | ||||||
| Different Human System Profiles of Target | Top |
|---|---|
|
Human Similarity Proteins
of target is determined by comparing the sequence similarity of all human proteins with the target based on BLAST. The similarity proteins for a target are defined as the proteins with E-value < 0.005 and outside the protein families of the target.
A target that has fewer human similarity proteins outside its family is commonly regarded to possess a greater capacity to avoid undesired interactions and thus increase the possibility of finding successful drugs
(Brief Bioinform, 21: 649-662, 2020).
Human Tissue Distribution
of target is determined from a proteomics study that quantified more than 12,000 genes across 32 normal human tissues. Tissue Specificity (TS) score was used to define the enrichment of target across tissues.
The distribution of targets among different tissues or organs need to be taken into consideration when assessing the target druggability, as it is generally accepted that the wider the target distribution, the greater the concern over potential adverse effects
(Nat Rev Drug Discov, 20: 64-81, 2021).
Human Pathway Affiliation
of target is determined by the life-essential pathways provided on KEGG database. The target-affiliated pathways were defined based on the following two criteria (a) the pathways of the studied target should be life-essential for both healthy individuals and patients, and (b) the studied target should occupy an upstream position in the pathways and therefore had the ability to regulate biological function.
Targets involved in a fewer pathways have greater likelihood to be successfully developed, while those associated with more human pathways increase the chance of undesirable interferences with other human processes
(Pharmacol Rev, 58: 259-279, 2006).
Biological Network Descriptors
of target is determined based on a human protein-protein interactions (PPI) network consisting of 9,309 proteins and 52,713 PPIs, which were with a high confidence score of ≥ 0.95 collected from STRING database.
The network properties of targets based on protein-protein interactions (PPIs) have been widely adopted for the assessment of target’s druggability. Proteins with high node degree tend to have a high impact on network function through multiple interactions, while proteins with high betweenness centrality are regarded to be central for communication in interaction networks and regulate the flow of signaling information
(Front Pharmacol, 9, 1245, 2018;
Curr Opin Struct Biol. 44:134-142, 2017).
Human Similarity Proteins
Human Tissue Distribution
Human Pathway Affiliation
Biological Network Descriptors
|
|
|
There is no similarity protein (E value < 0.005) for this target
|
|
Note:
If a protein has TS (tissue specficity) scores at least in one tissue >= 2.5, this protein is called tissue-enriched (including tissue-enriched-but-not-specific and tissue-specific). In the plots, the vertical lines are at thresholds 2.5 and 4.
|

| KEGG Pathway | Pathway ID | Affiliated Target | Pathway Map |
|---|---|---|---|
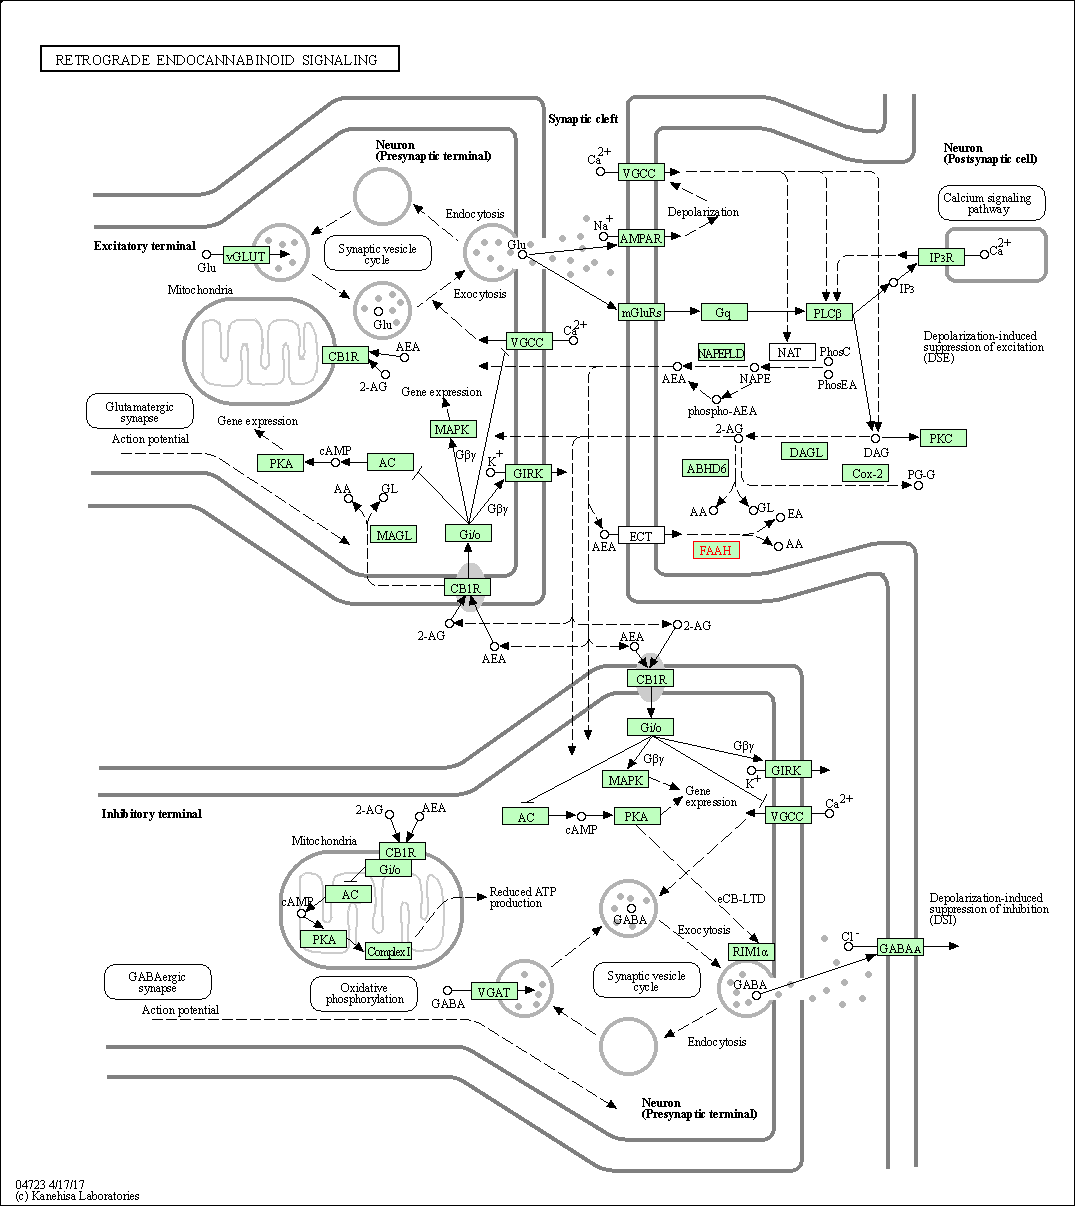
| Retrograde endocannabinoid signaling | hsa04723 | Affiliated Target |

|
| Class: Organismal Systems => Nervous system | Pathway Hierarchy | ||
| Degree | 2 | Degree centrality | 2.15E-04 | Betweenness centrality | 2.02E-04 |
|---|---|---|---|---|---|
| Closeness centrality | 1.68E-01 | Radiality | 1.26E+01 | Clustering coefficient | 0.00E+00 |
| Neighborhood connectivity | 4.00E+00 | Topological coefficient | 5.00E-01 | Eccentricity | 13 |
| Download | Click to Download the Full PPI Network of This Target | ||||
| Chemical Structure based Activity Landscape of Target | Top |
|---|---|
| Drug Property Profile of Target | Top | |
|---|---|---|
| (1) Molecular Weight (mw) based Drug Clustering | (2) Octanol/Water Partition Coefficient (xlogp) based Drug Clustering | |
|
|
||
| (3) Hydrogen Bond Donor Count (hbonddonor) based Drug Clustering | (4) Hydrogen Bond Acceptor Count (hbondacc) based Drug Clustering | |
|
|
||
| (5) Rotatable Bond Count (rotbonds) based Drug Clustering | (6) Topological Polar Surface Area (polararea) based Drug Clustering | |
|
|
||
| "RO5" indicates the cutoff set by lipinski's rule of five; "D123AB" colored in GREEN denotes the no violation of any cutoff in lipinski's rule of five; "D123AB" colored in PURPLE refers to the violation of only one cutoff in lipinski's rule of five; "D123AB" colored in BLACK represents the violation of more than one cutoffs in lipinski's rule of five | ||
| Target Affiliated Biological Pathways | Top | |||||
|---|---|---|---|---|---|---|
| KEGG Pathway | [+] 1 KEGG Pathways | + | ||||
| 1 | Retrograde endocannabinoid signaling | |||||
| References | Top | |||||
|---|---|---|---|---|---|---|
| REF 1 | Fatty acid amide hydrolase inhibitors: a patent review (2009-2014).Expert Opin Ther Pat. 2015;25(11):1247-66. | |||||
If You Find Any Error in Data or Bug in Web Service, Please Kindly Report It to Dr. Zhou and Dr. Zhang.

