Target Information
| Target General Information | Top | |||||
|---|---|---|---|---|---|---|
| Target ID |
T30846
|
|||||
| Target Name |
Leukocyte immunoglobulin-like receptor B4 (LILRB4)
|
|||||
| Synonyms |
CD85 antigen-like family member K; Immunoglobulin-like transcript 3; ILT-3; Leukocyte immunoglobulin-like receptor 5; LIR-5; Monocyte inhibitory receptor HM18; DE AltName: CD_antigen=CD85k
Click to Show/Hide
|
|||||
| Gene Name |
LILRB4
|
|||||
| Target Type |
Clinical trial target
|
[1] | ||||
| Disease | [+] 2 Target-related Diseases | + | ||||
| 1 | Acute myeloid leukaemia [ICD-11: 2A60] | |||||
| 2 | Chronic myelomonocytic leukaemia [ICD-11: 2A40] | |||||
| Function |
Receptor for class I MHC antigens. Recognizes a broad spectrum of HLA-A, HLA-B, HLA-C and HLA-G alleles. Involved in the down-regulation of the immune response and the development of tolerance, e.g. towards transplants. Interferes with TNFRSF5-signaling and NF-kappa-B up-regulation. Inhibits receptor-mediated phosphorylation of cellular proteins and mobilization of intracellular calcium ions.
Click to Show/Hide
|
|||||
| UniProt ID | ||||||
| Sequence |
MIPTFTALLCLGLSLGPRTHMQAGPLPKPTLWAEPGSVISWGNSVTIWCQGTLEAREYRL
DKEESPAPWDRQNPLEPKNKARFSIPSMTEDYAGRYRCYYRSPVGWSQPSDPLELVMTGA YSKPTLSALPSPLVTSGKSVTLLCQSRSPMDTFLLIKERAAHPLLHLRSEHGAQQHQAEF PMSPVTSVHGGTYRCFSSHGFSHYLLSHPSDPLELIVSGSLEDPRPSPTRSVSTAAGPED QPLMPTGSVPHSGLRRHWEVLIGVLVVSILLLSLLLFLLLQHWRQGKHRTLAQRQADFQR PPGAAEPEPKDGGLQRRSSPAADVQGENFCAAVKNTQPEDGVEMDTRQSPHDEDPQAVTY AKVKHSRPRREMASPPSPLSGEFLDTKDRQAEEDRQMDTEAAASEAPQDVTYAQLHSFTL RQKATEPPPSQEGASPAEPSVYATLAIH Click to Show/Hide
|
|||||
| 3D Structure | Click to Show 3D Structure of This Target | AlphaFold | ||||
| Drugs and Modes of Action | Top | |||||
|---|---|---|---|---|---|---|
| Clinical Trial Drug(s) | [+] 1 Clinical Trial Drugs | + | ||||
| 1 | IO-202 | Drug Info | Phase 1 | Acute myeloid leukaemia | [2] | |
| Mode of Action | [+] 1 Modes of Action | + | ||||
| Inhibitor | [+] 1 Inhibitor drugs | + | ||||
| 1 | IO-202 | Drug Info | [1] | |||
| Cell-based Target Expression Variations | Top | |||||
|---|---|---|---|---|---|---|
| Cell-based Target Expression Variations | ||||||
| Different Human System Profiles of Target | Top |
|---|---|
|
Human Similarity Proteins
of target is determined by comparing the sequence similarity of all human proteins with the target based on BLAST. The similarity proteins for a target are defined as the proteins with E-value < 0.005 and outside the protein families of the target.
A target that has fewer human similarity proteins outside its family is commonly regarded to possess a greater capacity to avoid undesired interactions and thus increase the possibility of finding successful drugs
(Brief Bioinform, 21: 649-662, 2020).
Human Tissue Distribution
of target is determined from a proteomics study that quantified more than 12,000 genes across 32 normal human tissues. Tissue Specificity (TS) score was used to define the enrichment of target across tissues.
The distribution of targets among different tissues or organs need to be taken into consideration when assessing the target druggability, as it is generally accepted that the wider the target distribution, the greater the concern over potential adverse effects
(Nat Rev Drug Discov, 20: 64-81, 2021).
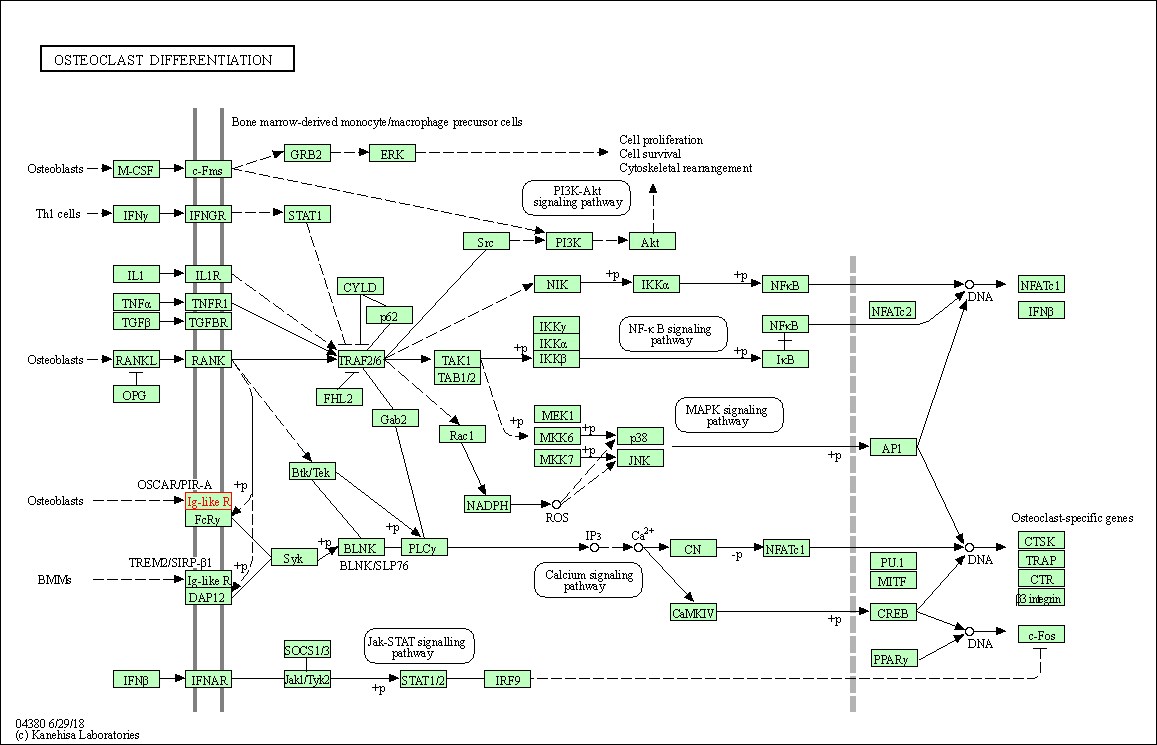
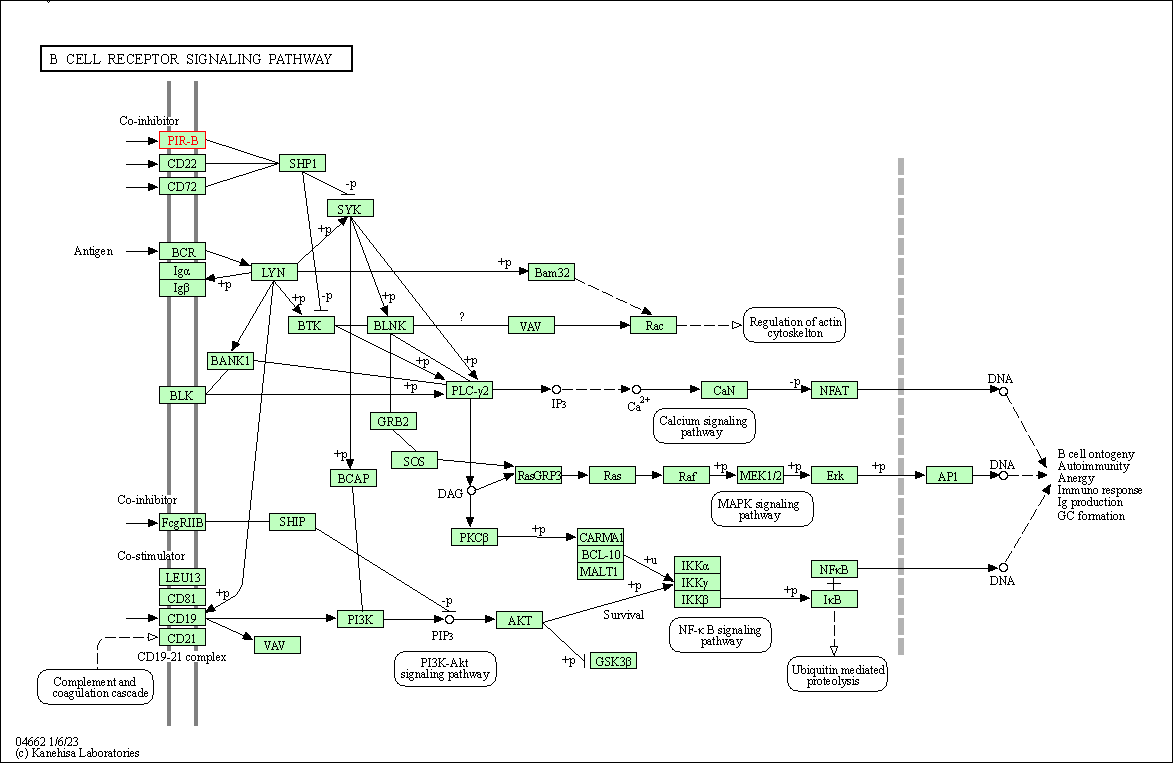
Human Pathway Affiliation
of target is determined by the life-essential pathways provided on KEGG database. The target-affiliated pathways were defined based on the following two criteria (a) the pathways of the studied target should be life-essential for both healthy individuals and patients, and (b) the studied target should occupy an upstream position in the pathways and therefore had the ability to regulate biological function.
Targets involved in a fewer pathways have greater likelihood to be successfully developed, while those associated with more human pathways increase the chance of undesirable interferences with other human processes
(Pharmacol Rev, 58: 259-279, 2006).
Human Similarity Proteins
Human Tissue Distribution
Human Pathway Affiliation
|
|
| Protein Name | Pfam ID | Percentage of Identity (%) | E value |
|---|---|---|---|
| Natural cytotoxic triggering receptor 1 (NCR1) | 38.019 (119/313) | 3.16E-53 | |
| Immunoglobulin alpha Fc receptor (FCAR) | 35.885 (75/209) | 5.31E-25 | |
|
Note:
If a protein has TS (tissue specficity) scores at least in one tissue >= 2.5, this protein is called tissue-enriched (including tissue-enriched-but-not-specific and tissue-specific). In the plots, the vertical lines are at thresholds 2.5 and 4.
|
| KEGG Pathway | Pathway ID | Affiliated Target | Pathway Map |
|---|---|---|---|
| Osteoclast differentiation | hsa04380 | Affiliated Target |

|
| Class: Organismal Systems => Development and regeneration | Pathway Hierarchy | ||
| B cell receptor signaling pathway | hsa04662 | Affiliated Target |

|
| Class: Organismal Systems => Immune system | Pathway Hierarchy | ||
| References | Top | |||||
|---|---|---|---|---|---|---|
| REF 1 | Clinical pipeline report, company report or official report of Immune-Onc Therapeutics. | |||||
| REF 2 | ClinicalTrials.gov (NCT04372433) IO-202 as Monotherapy in Patients in AML and CMML. U.S. National Institutes of Health. | |||||
If You Find Any Error in Data or Bug in Web Service, Please Kindly Report It to Dr. Zhou and Dr. Zhang.

