Target Information
| Target General Information | Top | |||||
|---|---|---|---|---|---|---|
| Target ID |
T11791
(Former ID: TTDI03007)
|
|||||
| Target Name |
Acetyl-CoA transporter (SLC33A1)
|
|||||
| Synonyms |
Solute carrier family 33 member 1; Acetyl-coenzyme A transporter 1; Acetyl-CoA transporter 1; AT1 protein; AT-1; ACATN
Click to Show/Hide
|
|||||
| Gene Name |
SLC33A1
|
|||||
| Target Type |
Patented-recorded target
|
[1] | ||||
| Function |
Negatively regulates BMP signaling. Probable acetyl-CoA transporter necessary for O-acetylation of gangliosides.
Click to Show/Hide
|
|||||
| BioChemical Class |
Major facilitator
|
|||||
| UniProt ID | ||||||
| Sequence |
MSPTISHKDSSRQRRPGNFSHSLDMKSGPLPPGGWDDSHLDSAGREGDREALLGDTGTGD
FLKAPQSFRAELSSILLLLFLYVLQGIPLGLAGSIPLILQSKNVSYTDQAFFSFVFWPFS LKLLWAPLVDAVYVKNFGRRKSWLVPTQYILGLFMIYLSTQVDRLLGNTDDRTPDVIALT VAFFLFEFLAATQDIAVDGWALTMLSRENVGYASTCNSVGQTAGYFLGNVLFLALESADF CNKYLRFQPQPRGIVTLSDFLFFWGTVFLITTTLVALLKKENEVSVVKEETQGITDTYKL LFAIIKMPAVLTFCLLILTAKIGFSAADAVTGLKLVEEGVPKEHLALLAVPMVPLQIILP LIISKYTAGPQPLNTFYKAMPYRLLLGLEYALLVWWTPKVEHQGGFPIYYYIVVLLSYAL HQVTVYSMYVSIMAFNAKVSDPLIGGTYMTLLNTVSNLGGNWPSTVALWLVDPLTVKECV GASNQNCRTPDAVELCKKLGGSCVTALDGYYVESIICVFIGFGWWFFLGPKFKKLQDEGS SSWKCKRNN Click to Show/Hide
|
|||||
| 3D Structure | Click to Show 3D Structure of This Target | AlphaFold | ||||
| Cell-based Target Expression Variations | Top | |||||
|---|---|---|---|---|---|---|
| Cell-based Target Expression Variations | ||||||
| Different Human System Profiles of Target | Top |
|---|---|
|
Human Similarity Proteins
of target is determined by comparing the sequence similarity of all human proteins with the target based on BLAST. The similarity proteins for a target are defined as the proteins with E-value < 0.005 and outside the protein families of the target.
A target that has fewer human similarity proteins outside its family is commonly regarded to possess a greater capacity to avoid undesired interactions and thus increase the possibility of finding successful drugs
(Brief Bioinform, 21: 649-662, 2020).
Human Tissue Distribution
of target is determined from a proteomics study that quantified more than 12,000 genes across 32 normal human tissues. Tissue Specificity (TS) score was used to define the enrichment of target across tissues.
The distribution of targets among different tissues or organs need to be taken into consideration when assessing the target druggability, as it is generally accepted that the wider the target distribution, the greater the concern over potential adverse effects
(Nat Rev Drug Discov, 20: 64-81, 2021).
Human Pathway Affiliation
of target is determined by the life-essential pathways provided on KEGG database. The target-affiliated pathways were defined based on the following two criteria (a) the pathways of the studied target should be life-essential for both healthy individuals and patients, and (b) the studied target should occupy an upstream position in the pathways and therefore had the ability to regulate biological function.
Targets involved in a fewer pathways have greater likelihood to be successfully developed, while those associated with more human pathways increase the chance of undesirable interferences with other human processes
(Pharmacol Rev, 58: 259-279, 2006).
Human Similarity Proteins
Human Tissue Distribution
Human Pathway Affiliation
|
|
| Protein Name | Pfam ID | Percentage of Identity (%) | E value |
|---|---|---|---|
| Major facilitator superfamily domain-containing protein 3 (MFSD3) | 30.714 (43/140) | 3.39E-06 |
|
Note:
If a protein has TS (tissue specficity) scores at least in one tissue >= 2.5, this protein is called tissue-enriched (including tissue-enriched-but-not-specific and tissue-specific). In the plots, the vertical lines are at thresholds 2.5 and 4.
|

| KEGG Pathway | Pathway ID | Affiliated Target | Pathway Map |
|---|---|---|---|
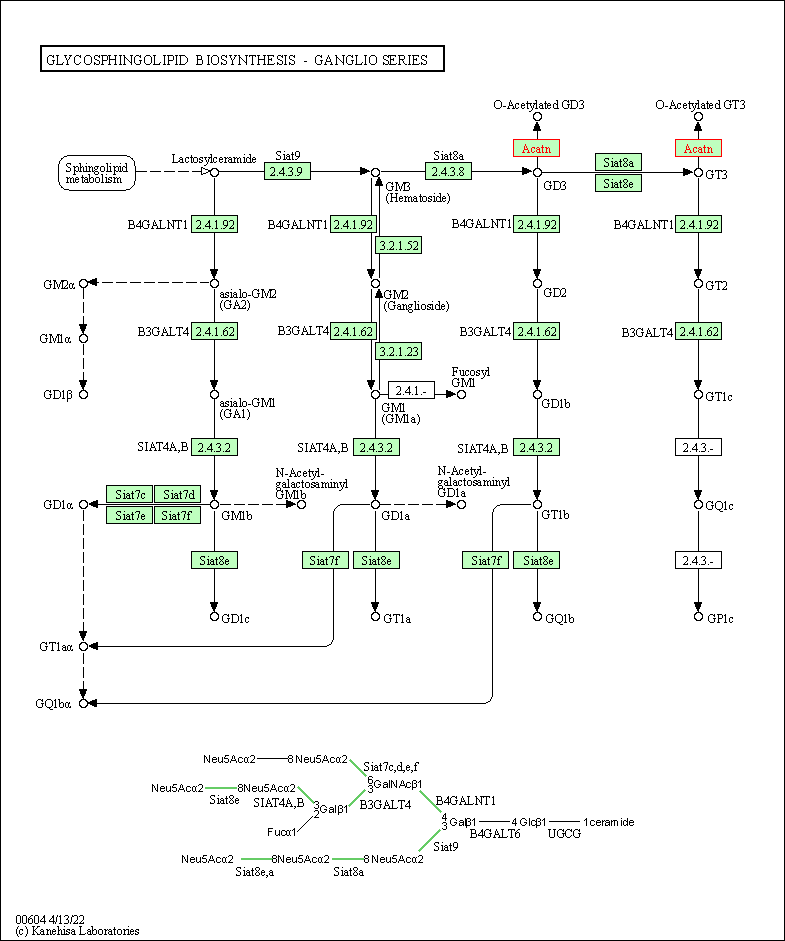
| Glycosphingolipid biosynthesis - ganglio series | hsa00604 | Affiliated Target |

|
| Class: Metabolism => Glycan biosynthesis and metabolism | Pathway Hierarchy | ||
| Drug Property Profile of Target | Top | |
|---|---|---|
| (1) Molecular Weight (mw) based Drug Clustering | (2) Octanol/Water Partition Coefficient (xlogp) based Drug Clustering | |
|
|
||
| (3) Hydrogen Bond Donor Count (hbonddonor) based Drug Clustering | (4) Hydrogen Bond Acceptor Count (hbondacc) based Drug Clustering | |
|
|
||
| (5) Rotatable Bond Count (rotbonds) based Drug Clustering | (6) Topological Polar Surface Area (polararea) based Drug Clustering | |
|
|
||
| "RO5" indicates the cutoff set by lipinski's rule of five; "D123AB" colored in GREEN denotes the no violation of any cutoff in lipinski's rule of five; "D123AB" colored in PURPLE refers to the violation of only one cutoff in lipinski's rule of five; "D123AB" colored in BLACK represents the violation of more than one cutoffs in lipinski's rule of five | ||
| Target Regulators | Top | |||||
|---|---|---|---|---|---|---|
| Target-regulating microRNAs | ||||||
| References | Top | |||||
|---|---|---|---|---|---|---|
| REF 1 | URL: http://www.guidetopharmacology.org Nucleic Acids Res. 2015 Oct 12. pii: gkv1037. The IUPHAR/BPS Guide to PHARMACOLOGY in 2016: towards curated quantitative interactions between 1300 protein targets and 6000 ligands. (Target id: 1134). | |||||
| REF 2 | Fused ring compound and use thereof. US8592431. | |||||
If You Find Any Error in Data or Bug in Web Service, Please Kindly Report It to Dr. Zhou and Dr. Zhang.

