Target expression details
| Target's General Information | |||||
|---|---|---|---|---|---|
| Target ID | T65200 | ||||
| Target Name | Corticosteroid 11-beta-dehydrogenase 1 (HSD11B1) | ||||
| Synonyms | HSD11B1; 11beta-HSD1A; 11HSD1; 11-beta-hydroxysteroid dehydrogenase 1; 11-beta-HSD1; 11-DH; 11 beta-hydroxysteroid dehydrogenase type 1 | ||||
| Target Type | Clinical trial | ||||
| Gene Name | HSD11B1 | ||||
| Biochemical Class | Short-chain dehydrogenases reductase | ||||
| UniProt ID | DHI1_HUMAN | ||||
| Target's Expression Profile in Disease Related Tissue between Patients and Normal People | |||||
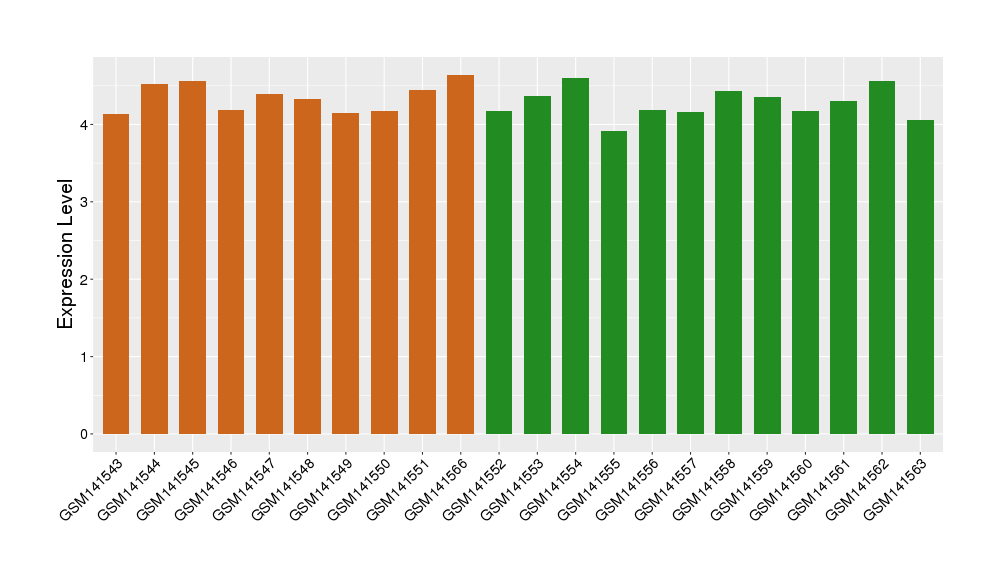
| Disease | Type 2 diabetes | ||||
| Example drug | INCB13739 | Phase 2a | [1], [2], [3] | ||
| Tissue | Liver tissue | ||||
| Level of differential expression between the patients in the disease section of the tissue and the tissues of healthy individual |
Fold-change: -0.01 Z-score: -0.08 P-value: 2.03E-01 |
||||
|
Target gene expression profiles of the patients in the disease section of the tissue
Target gene expression profiles in the tissue of healthy individual

|
|||||
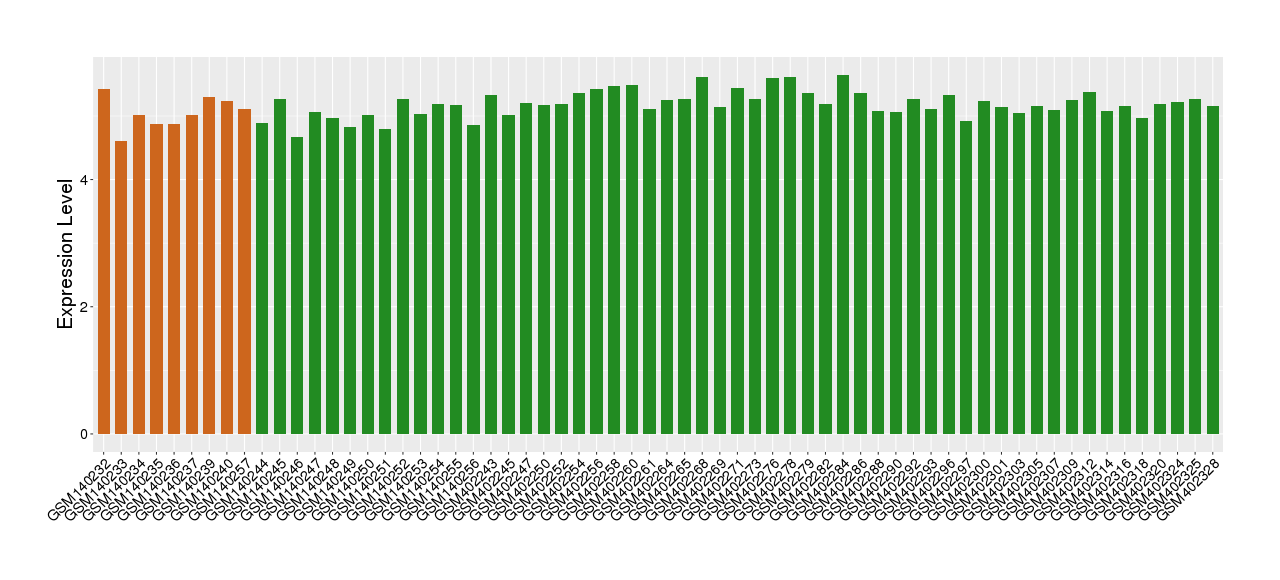
| Disease | Arteriosclerosis | ||||
| Tissue | Peripheral blood | ||||
| Level of differential expression between the patients in the disease section of the tissue and the tissues of healthy individual |
Fold-change: 0.11 Z-score: 0.56 P-value: 3.53E-01 |
||||
|
Target gene expression profiles of the patients in the disease section of the tissue
Target gene expression profiles in the tissue of healthy individual

|
|||||
| Disease | Familial hypercholesterolemia | ||||
| Tissue | Whole blood | ||||
| Level of differential expression between the patients in the disease section of the tissue and the tissues of healthy individual |
Fold-change: -0.16 Z-score: -0.79 P-value: 1.35E-01 |
||||
|
Target gene expression profiles of the patients in the disease section of the tissue
Target gene expression profiles in the tissue of healthy individual

|
|||||
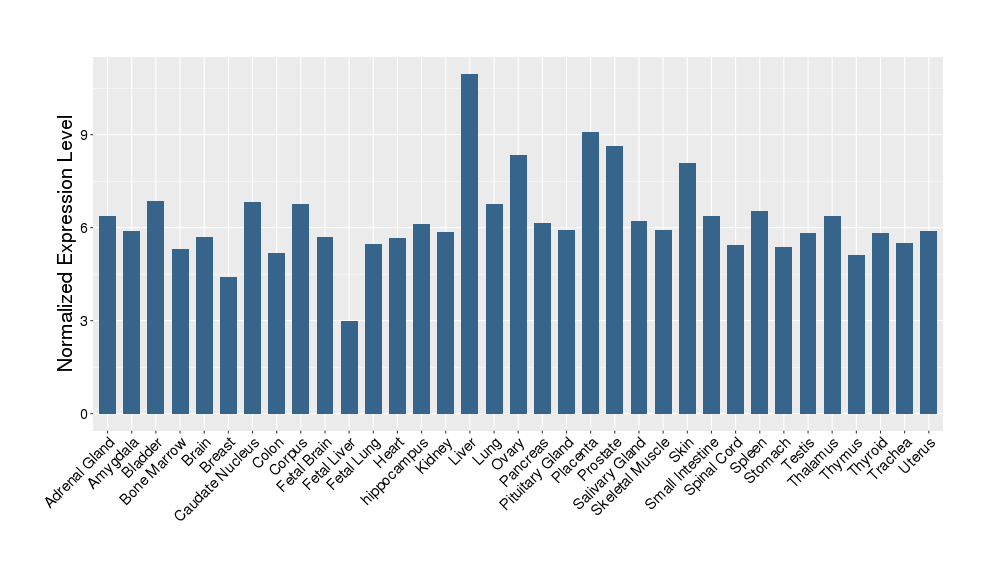
| Target's Expression Profile across Various Tissues of Healthy Individual | |||||

|
|||||
| References | |||||
| REF 1 | ClinicalTrials.gov (NCT00698230) Safety and Efficacy of INCB013739 Plus Metformin Compared to Metformin Alone on Glycemic Control in Type 2 Diabetics. U.S. National Institutes of Health. | ||||
| REF 2 | Interpreting expression profiles of cancers by genome-wide survey of breadth of expression in normal tissues. Genomics 2005 Aug;86(2):127-41. | ||||
| REF 3 | NCBI GEO: archive for functional genomics data sets--update. Nucleic Acids Res. 2013 Jan;41(Database issue):D991-5. | ||||
If You Find Any Error in Data or Bug in Web Service, Please Kindly Report It to Dr. Zhou and Dr. Zhang.

