Target expression details
| Target's General Information | |||||
|---|---|---|---|---|---|
| Target ID | T31309 | ||||
| Target Name | Apoptosis regulator Bcl-2 (BCL-2) | ||||
| Synonyms | Bcl-2 | ||||
| Target Type | Successful | ||||
| Gene Name | BCL2 | ||||
| Biochemical Class | B-cell lymphoma Bcl-2 | ||||
| UniProt ID | BCL2_HUMAN | ||||
| Target's Expression Profile in Disease Related Tissue between Patients and Normal People | |||||
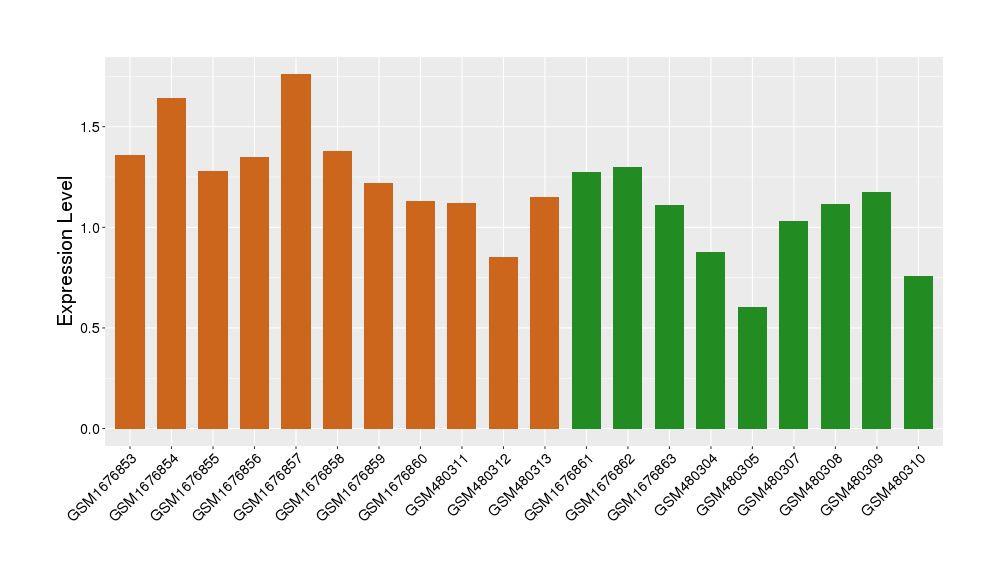
| Disease | Lateral sclerosis | ||||
| Example drug | Edaravone | Approved | [1], [2], [3] | ||
| Tissue | Cervical spinal cord | ||||
| Level of differential expression between the patients in the disease section of the tissue and the tissues of healthy individual |
Fold-change: 0.17 Z-score: 0.72 P-value: 2.52E-02 |
||||
|
Target gene expression profiles of the patients in the disease section of the tissue
Target gene expression profiles in the tissue of healthy individual

|
|||||
| Disease | Breast cancer | ||||
| Example drug | Taxol/Paraplatin/Herceptin | Phase 3 | [2], [3], [4] | ||
| Tissue | Breast tissue | ||||
| Level of differential expression between the patients in the disease section of the tissue and the tissues of healthy individual |
Fold-change: -0.23 Z-score: -0.74 P-value: 1.08E-24 |
||||
| Level of differential expression between the patients in the disease section of the tissue section of the tissue adjacent to the disease section |
Fold-change: -0.07 Z-score: -0.19 P-value: 1.67E-01 |
||||
|
Target gene expression profiles of the patients in the disease section of the tissue
Target gene expression profiles of the patients in the normal section of the tissue adjacent to the disease section
Target gene expression profiles in the tissue of healthy individual

|
|||||
| Disease | Lung cancer | ||||
| Example drug | ABT-263 | Phase 2 | [2], [3], [5], [6] | ||
| Tissue | Lung tissue | ||||
| Level of differential expression between the patients in the disease section of the tissue and the tissues of healthy individual |
Fold-change: 1.35E-02 Z-score: 0.05 P-value: 9.45E-01 |
||||
| Level of differential expression between the patients in the disease section of the tissue section of the tissue adjacent to the disease section |
Fold-change: 0.08 Z-score: 0.37 P-value: 2.56E-04 |
||||
|
Target gene expression profiles of the patients in the disease section of the tissue
Target gene expression profiles of the patients in the normal section of the tissue adjacent to the disease section
Target gene expression profiles in the tissue of healthy individual

|
|||||
| Disease | Prostate cancer | ||||
| Example drug | Gossypol | Phase 2 | [2], [3], [7], [8] | ||
| Tissue | Prostate | ||||
| Level of differential expression between the patients in the disease section of the tissue and the tissues of healthy individual |
Fold-change: 0.16 Z-score: 0.62 P-value: 1.29E-02 |
||||
|
Target gene expression profiles of the patients in the disease section of the tissue
Target gene expression profiles in the tissue of healthy individual

|
|||||
| Disease | Psoriasis | ||||
| Example drug | Pc4 (topical formulation | Phase 1 | [9], [2], [3] | ||
| Tissue | Skin | ||||
| Level of differential expression between the patients in the disease section of the tissue and the tissues of healthy individual |
Fold-change: 0.04 Z-score: 0.19 P-value: 5.22E-01 |
||||
| Level of differential expression between the patients in the disease section of the tissue section of the tissue adjacent to the disease section |
Fold-change: 0.03 Z-score: 0.13 P-value: 5.40E-01 |
||||
|
Target gene expression profiles of the patients in the disease section of the tissue
Target gene expression profiles of the patients in the normal section of the tissue adjacent to the disease section
Target gene expression profiles in the tissue of healthy individual

|
|||||
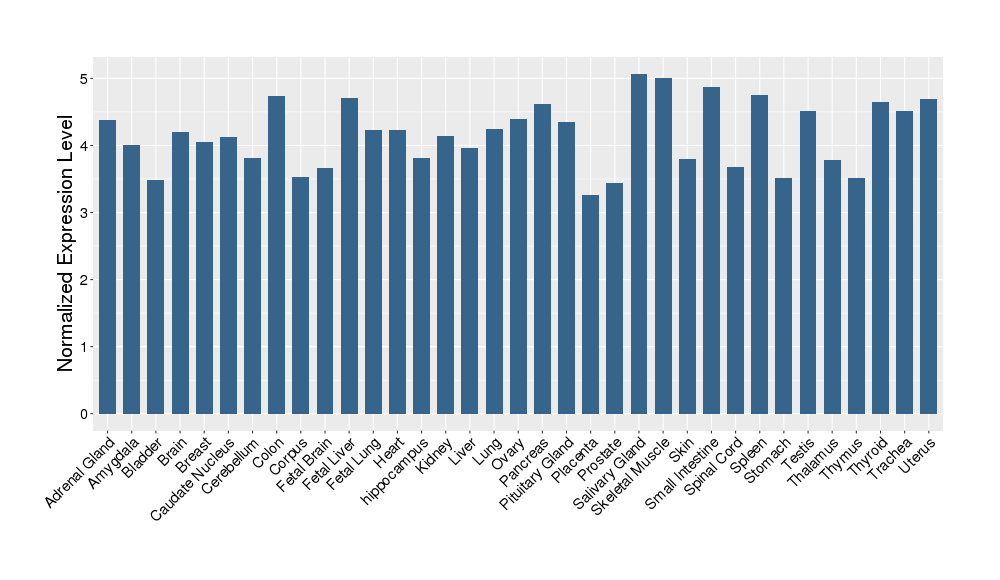
| Target's Expression Profile across Various Tissues of Healthy Individual | |||||

|
|||||
| References | |||||
| REF 1 | Drugs@FDA. U.S. Food and Drug Administration. U.S. Department of Health & Human Services. 2018 | ||||
| REF 2 | Interpreting expression profiles of cancers by genome-wide survey of breadth of expression in normal tissues. Genomics 2005 Aug;86(2):127-41. | ||||
| REF 3 | NCBI GEO: archive for functional genomics data sets--update. Nucleic Acids Res. 2013 Jan;41(Database issue):D991-5. | ||||
| REF 4 | Randomized phase III study of trastuzumab, paclitaxel, and carboplatin compared with trastuzumab and paclitaxel in women with HER-2-overexpressing metastatic breast cancer. J Clin Oncol. 2006 Jun 20;24(18):2786-92. | ||||
| REF 5 | URL: http://www.guidetopharmacology.org Nucleic Acids Res. 2015 Oct 12. pii: gkv1037. The IUPHAR/BPS Guide to PHARMACOLOGY in 2016: towards curated quantitative interactions between 1300 protein targets and 6000 ligands. (Ligand id: 8319). | ||||
| REF 6 | Clinical pipeline report, company report or official report of Roche (2009). | ||||
| REF 7 | URL: http://www.guidetopharmacology.org Nucleic Acids Res. 2015 Oct 12. pii: gkv1037. The IUPHAR/BPS Guide to PHARMACOLOGY in 2016: towards curated quantitative interactions between 1300 protein targets and 6000 ligands. (Ligand id: 4204). | ||||
| REF 8 | ClinicalTrials.gov (NCT00848016) Gossypol Acetic Acid in Treating Patients With Recurrent, Metastatic, or Primary Adrenocortical Cancer That Cannot Be Removed By Surgery. U.S. National Institutes of Health. | ||||
| REF 9 | Association between the photodynamic loss of Bcl-2 and the sensitivity to apoptosis caused by phthalocyanine photodynamic therapy. Photochem Photobiol. 2003 Jul;78(1):1-8. | ||||
If You Find Any Error in Data or Bug in Web Service, Please Kindly Report It to Dr. Zhou and Dr. Zhang.

