Target expression details
| Target's General Information | |||||
|---|---|---|---|---|---|
| Target ID | T16601 | ||||
| Target Name | Carcinoembryonic antigen CEA (CD66e) | ||||
| Synonyms | Meconium antigen 100; Carcinoembryonic antigen-related cell adhesion molecule 5; CEA; CD66e antigen | ||||
| Target Type | Clinical trial | ||||
| Gene Name | CEACAM5 | ||||
| Biochemical Class | Immunoglobulin | ||||
| UniProt ID | CEAM5_HUMAN | ||||
| Target's Expression Profile in Disease Related Tissue between Patients and Normal People | |||||
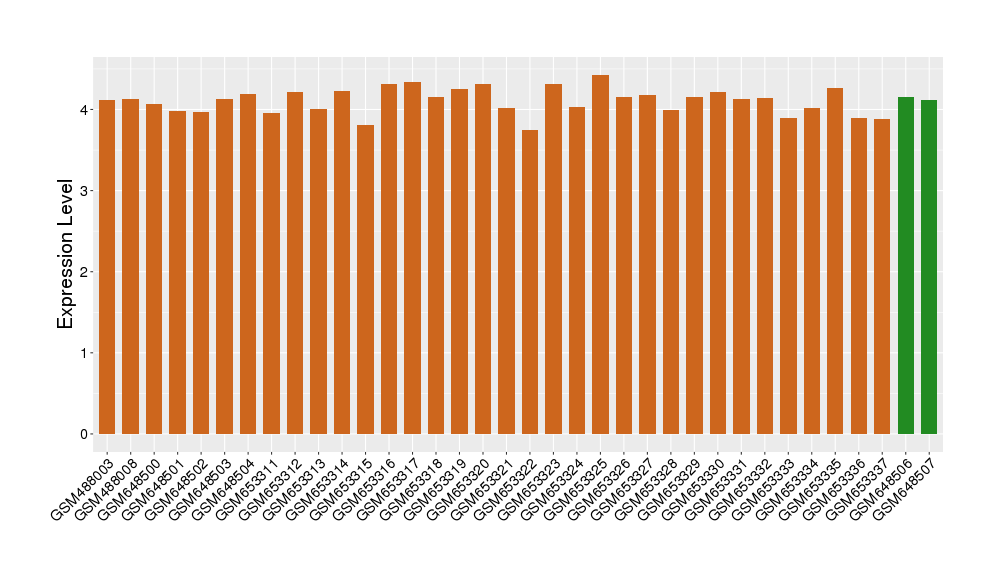
| Disease | Lung cancer | ||||
| Example drug | Pentacea | Phase 2 | [1], [2], [3] | ||
| Tissue | Lung tissue | ||||
| Level of differential expression between the patients in the disease section of the tissue and the tissues of healthy individual |
Fold-change: 1.21 Z-score: 1.59 P-value: 5.59E-43 |
||||
| Level of differential expression between the patients in the disease section of the tissue section of the tissue adjacent to the disease section |
Fold-change: 1.2 Z-score: 1.43 P-value: 5.64E-26 |
||||
|
Target gene expression profiles of the patients in the disease section of the tissue
Target gene expression profiles of the patients in the normal section of the tissue adjacent to the disease section
Target gene expression profiles in the tissue of healthy individual

|
|||||
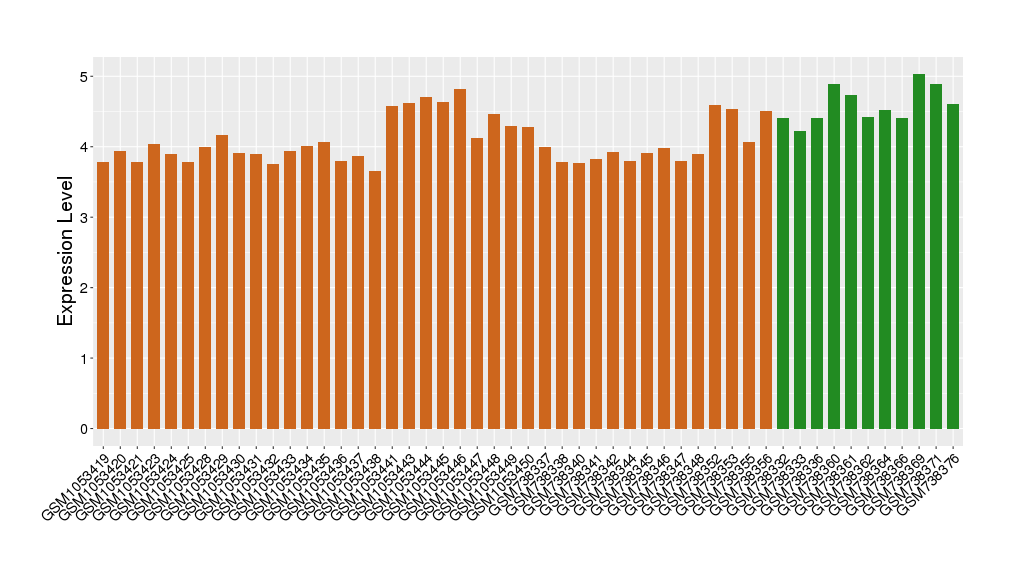
| Disease | Breast cancer | ||||
| Example drug | CT84.66 | Phase 1/2 | [2], [3], [4] | ||
| Tissue | Breast tissue | ||||
| Level of differential expression between the patients in the disease section of the tissue and the tissues of healthy individual |
Fold-change: 0.29 Z-score: 1.07 P-value: 6.68E-91 |
||||
| Level of differential expression between the patients in the disease section of the tissue section of the tissue adjacent to the disease section |
Fold-change: 0.17 Z-score: 0.25 P-value: 3.01E-06 |
||||
|
Target gene expression profiles of the patients in the disease section of the tissue
Target gene expression profiles of the patients in the normal section of the tissue adjacent to the disease section
Target gene expression profiles in the tissue of healthy individual

|
|||||
| Disease | Glioma | ||||
| Example drug | MV-CEA | Phase 1 | [2], [3], [5] | ||
| Tissue | Brainstem tissue | ||||
| Level of differential expression between the patients in the disease section of the tissue and the tissues of healthy individual |
Fold-change: -2.02E-03 Z-score: -0.08 P-value: 4.49E-01 |
||||
|
Target gene expression profiles of the patients in the disease section of the tissue
Target gene expression profiles in the tissue of healthy individual

|
|||||
| Disease | Glioma | ||||
| Example drug | MV-CEA | Phase 1 | [2], [3], [5] | ||
| Tissue | White matter | ||||
| Level of differential expression between the patients in the disease section of the tissue and the tissues of healthy individual |
Fold-change: -0.56 Z-score: -2.16 P-value: 2.23E-05 |
||||
|
Target gene expression profiles of the patients in the disease section of the tissue
Target gene expression profiles in the tissue of healthy individual

|
|||||
| Disease | Thyroid cancer | ||||
| Example drug | GI-6207 | Phase 1 | [2], [3], [6] | ||
| Tissue | Thyroid | ||||
| Level of differential expression between the patients in the disease section of the tissue and the tissues of healthy individual |
Fold-change: -0.01 Z-score: -0.03 P-value: 6.10E-01 |
||||
| Level of differential expression between the patients in the disease section of the tissue section of the tissue adjacent to the disease section |
Fold-change: -0.04 Z-score: -0.12 P-value: 1.93E-01 |
||||
|
Target gene expression profiles of the patients in the disease section of the tissue
Target gene expression profiles of the patients in the normal section of the tissue adjacent to the disease section
Target gene expression profiles in the tissue of healthy individual

|
|||||
| Disease | Rectal cancer | ||||
| Tissue | Rectal colon tissue | ||||
| Level of differential expression between the patients in the disease section of the tissue and the tissues of healthy individual |
Fold-change: 0.05 Z-score: 0.51 P-value: 5.33E-01 |
||||
| Level of differential expression between the patients in the disease section of the tissue section of the tissue adjacent to the disease section |
Fold-change: -0.11 Z-score: -0.63 P-value: 1.39E-01 |
||||
|
Target gene expression profiles of the patients in the disease section of the tissue
Target gene expression profiles of the patients in the normal section of the tissue adjacent to the disease section
Target gene expression profiles in the tissue of healthy individual

|
|||||
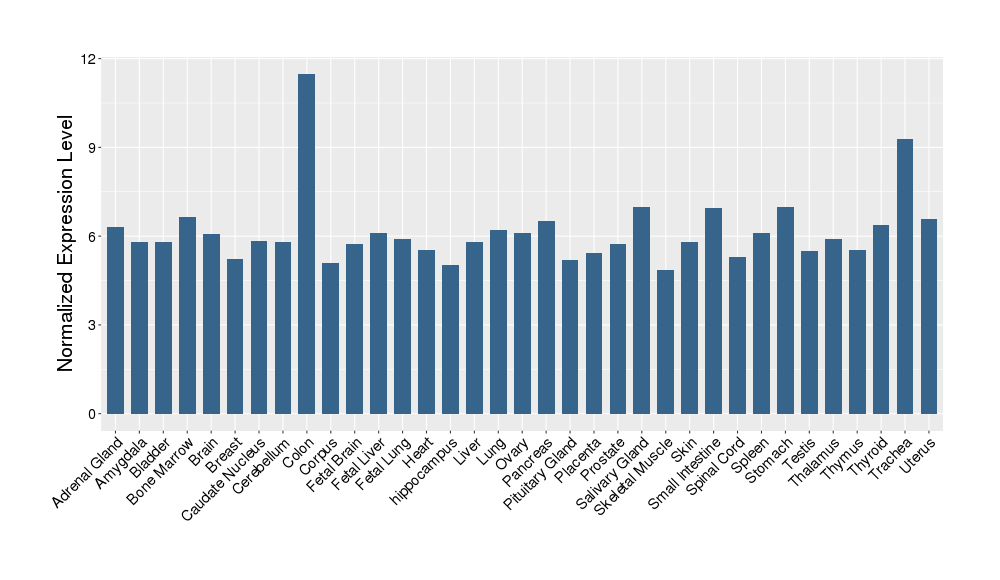
| Target's Expression Profile across Various Tissues of Healthy Individual | |||||

|
|||||
| References | |||||
| REF 1 | Trusted, scientifically sound profiles of drug programs, clinical trials, safety reports, and company deals, written by scientists. Springer. 2015. Adis Insight (drug id 800013510) | ||||
| REF 2 | Interpreting expression profiles of cancers by genome-wide survey of breadth of expression in normal tissues. Genomics 2005 Aug;86(2):127-41. | ||||
| REF 3 | NCBI GEO: archive for functional genomics data sets--update. Nucleic Acids Res. 2013 Jan;41(Database issue):D991-5. | ||||
| REF 4 | ClinicalTrials.gov (NCT00645710) Hepatic Arterial Infusion of Floxuridine, Gemcitabine Hydrochloride, and Radiolabeled Monoclonal Antibody Therapy in Treating Liver Metastases in Patients With Metastatic Colorectal Cancer Previously Treated With Surgery. U.S. National Institutes of Health. | ||||
| REF 5 | Phase I trial of intraperitoneal administration of an oncolytic measles virus strain engineered to express carcinoembryonic antigen for recurrent ovarian cancer. Cancer Res. 2010 Feb 1;70(3):875-82. | ||||
| REF 6 | ClinicalTrials.gov (NCT01856920) A Phase 2 Study of GI-6207 in Patients With Recurrent Medullary Thyroid Cancer. U.S. National Institutes of Health. | ||||
If You Find Any Error in Data or Bug in Web Service, Please Kindly Report It to Dr. Zhou and Dr. Zhang.

