Target Information
Target General Information | Top | |||||
---|---|---|---|---|---|---|
Target ID |
T45593
(Former ID: TTDI01945)
|
|||||
Target Name |
Microtubule-associated protein tau (MAPT)
|
|||||
Synonyms |
tau; Paired helical filamenttau; Paired helical filament-tau; Neurofibrillary tangle protein; MTBT1; MAPTL
Click to Show/Hide
|
|||||
Gene Name |
MAPT
|
|||||
Target Type |
Clinical trial target
|
[1] | ||||
Disease | [+] 3 Target-related Diseases | + | ||||
1 | Acute myeloid leukaemia [ICD-11: 2A60] | |||||
2 | Alzheimer disease [ICD-11: 8A20] | |||||
3 | Mild neurocognitive disorder [ICD-11: 6D71] | |||||
Function |
The C-terminus binds axonal microtubules while the N-terminus binds neural plasma membrane components, suggesting that tau functions as a linker protein between both. Axonal polarity is predetermined by TAU/MAPT localization (in the neuronal cell) in the domain of the cell body defined by the centrosome. The short isoforms allow plasticity of the cytoskeleton whereas the longer isoforms may preferentially play a role in its stabilization. Promotes microtubule assembly and stability, and might be involved in the establishment and maintenance of neuronal polarity.
Click to Show/Hide
|
|||||
UniProt ID | ||||||
Sequence |
MAEPRQEFEVMEDHAGTYGLGDRKDQGGYTMHQDQEGDTDAGLKESPLQTPTEDGSEEPG
SETSDAKSTPTAEDVTAPLVDEGAPGKQAAAQPHTEIPEGTTAEEAGIGDTPSLEDEAAG HVTQEPESGKVVQEGFLREPGPPGLSHQLMSGMPGAPLLPEGPREATRQPSGTGPEDTEG GRHAPELLKHQLLGDLHQEGPPLKGAGGKERPGSKEEVDEDRDVDESSPQDSPPSKASPA QDGRPPQTAAREATSIPGFPAEGAIPLPVDFLSKVSTEIPASEPDGPSVGRAKGQDAPLE FTFHVEITPNVQKEQAHSEEHLGRAAFPGAPGEGPEARGPSLGEDTKEADLPEPSEKQPA AAPRGKPVSRVPQLKARMVSKSKDGTGSDDKKAKTSTRSSAKTLKNRPCLSPKHPTPGSS DPLIQPSSPAVCPEPPSSPKYVSSVTSRTGSSGAKEMKLKGADGKTKIATPRGAAPPGQK GQANATRIPAKTPPAPKTPPSSGEPPKSGDRSGYSSPGSPGTPGSRSRTPSLPTPPTREP KKVAVVRTPPKSPSSAKSRLQTAPVPMPDLKNVKSKIGSTENLKHQPGGGKVQIINKKLD LSNVQSKCGSKDNIKHVPGGGSVQIVYKPVDLSKVTSKCGSLGNIHHKPGGGQVEVKSEK LDFKDRVQSKIGSLDNITHVPGGGNKKIETHKLTFRENAKAKTDHGAEIVYKSPVVSGDT SPRHLSNVSSTGSIDMVDSPQLATLADEVSASLAKQGL Click to Show/Hide
|
|||||
3D Structure | Click to Show 3D Structure of This Target | PDB | ||||
HIT2.0 ID | T93LMN |
Drugs and Modes of Action | Top | |||||
---|---|---|---|---|---|---|
Clinical Trial Drug(s) | [+] 17 Clinical Trial Drugs | + | ||||
1 | Davunetide | Drug Info | Phase 3 | Cognitive impairment | [1] | |
2 | LMT-X | Drug Info | Phase 3 | Acute myeloid leukaemia | [2] | |
3 | TRx0237 | Drug Info | Phase 3 | Alzheimer disease | [3] | |
4 | E2814 | Drug Info | Phase 2/3 | Alzheimer disease | [4] | |
5 | Bepranemab | Drug Info | Phase 2 | Alzheimer disease | [5] | |
6 | BIIB092 | Drug Info | Phase 2 | Progressive supranuclear palsy | [6] | |
7 | JNJ-63733657 | Drug Info | Phase 2 | Alzheimer disease | [7] | |
8 | PBT-2 | Drug Info | Phase 2 | Alzheimer disease | [8] | |
9 | RG6100 | Drug Info | Phase 2 | Alzheimer disease | [9] | |
10 | Semorinemab | Drug Info | Phase 2 | Alzheimer disease | [10] | |
11 | Tau-binding PET tracer | Drug Info | Phase 2 | Alzheimer disease | [11] | |
12 | APNmAb005 | Drug Info | Phase 1 | Alzheimer disease | [12] | |
13 | BEY2153 | Drug Info | Phase 1 | Alzheimer disease | [13] | |
14 | Lu AF87908 | Drug Info | Phase 1 | Alzheimer disease | [14] | |
15 | LY3303560 | Drug Info | Phase 1 | Alzheimer disease | [15] | |
16 | PRX-005 | Drug Info | Phase 1 | Alzheimer disease | [16] | |
17 | PTI-80 | Drug Info | Phase 1 | Alzheimer disease | [17] | |
Mode of Action | [+] 2 Modes of Action | + | ||||
Modulator | [+] 6 Modulator drugs | + | ||||
1 | Davunetide | Drug Info | [1] | |||
2 | PBT-2 | Drug Info | [23], [1] | |||
3 | Tau-binding PET tracer | Drug Info | [1] | |||
4 | AL-408 | Drug Info | [1] | |||
5 | BLV-0703 | Drug Info | [1] | |||
6 | NI-105 | Drug Info | [1] | |||
Inhibitor | [+] 11 Inhibitor drugs | + | ||||
1 | LMT-X | Drug Info | [1], [15], [18], [19] | |||
2 | TRx0237 | Drug Info | [20] | |||
3 | E2814 | Drug Info | [21] | |||
4 | Bepranemab | Drug Info | [22] | |||
5 | BIIB092 | Drug Info | [19] | |||
6 | RG6100 | Drug Info | [19], [15] | |||
7 | APNmAb005 | Drug Info | [25] | |||
8 | BEY2153 | Drug Info | [26] | |||
9 | Lu AF87908 | Drug Info | [27] | |||
10 | PRX-005 | Drug Info | [16] | |||
11 | PTI-80 | Drug Info | [28], [1] |
Cell-based Target Expression Variations | Top | |||||
---|---|---|---|---|---|---|
Cell-based Target Expression Variations |
Drug Binding Sites of Target | Top | |||||||||||||||||||||||||||||||||||||||||||||||||||||||||||||||||||||||||||||||||||
---|---|---|---|---|---|---|---|---|---|---|---|---|---|---|---|---|---|---|---|---|---|---|---|---|---|---|---|---|---|---|---|---|---|---|---|---|---|---|---|---|---|---|---|---|---|---|---|---|---|---|---|---|---|---|---|---|---|---|---|---|---|---|---|---|---|---|---|---|---|---|---|---|---|---|---|---|---|---|---|---|---|---|---|---|
Ligand Name: L-serine-O-phosphate | Ligand Info | |||||||||||||||||||||||||||||||||||||||||||||||||||||||||||||||||||||||||||||||||||
Structure Description | Crystal structure of C-terminal modified Tau peptide-hybrid 4.2f-II with 14-3-3sigma | PDB:6FBW | ||||||||||||||||||||||||||||||||||||||||||||||||||||||||||||||||||||||||||||||||||
Method | X-ray diffraction | Resolution | 1.45 Å | Mutation | No | [29] | ||||||||||||||||||||||||||||||||||||||||||||||||||||||||||||||||||||||||||||||
PDB Sequence |
RTPLPG
|
|||||||||||||||||||||||||||||||||||||||||||||||||||||||||||||||||||||||||||||||||||
☰Loading data... Dynamically generated for selected residues. Nodes can be dragged or clicked. Label: Selection: Name:
PDB ID: Option 1, search with your selection (all residues are selected by default) in the loaded structures: Option 2, search with PDB ID and chain name: PDB ID: Chain Name: Option 3, search with a PDB file: Foldseek web server. 1. your selection (all residues are selected by default) in the loaded structures to 2 (Optional). Once you see the structure neighbors, you can view the alignment in iCn3D by inputing a list of PDB chain IDs or AlphaFold UniProt IDs below. The PDB chain IDs are the same as the record names such as "1HHO_A". The UniProt ID is the text between "AF-" and "-F1". For example, the UniProt ID for the record name "AF-P69905-F1-model_v4" is "P69905". Chain ID List: BCIF/MMTF ID: PDB ID: Very high (pLDDT > 90) Confident (90 > pLDDT > 70) Low (70 > pLDDT > 50) Very low (pLDDT < 50) AlphaFold Uniprot ID: PAE Map: NCBI Protein Accession: PDB File: Multiple PDB Files: The custom JSON file on residue colors has the following format for proteins("ALA" and "ARG") and nucleotides("G" and "A"): {"ALA":"#C8C8C8", "ARG":"#145AFF", ..., "G":"#008000", "A":"#6080FF", ...} Residue Color File: The custom file for the structure has two columns separated by space or tab: residue number, and score in the range of 0-100. If you click "Apply Custom Color" button, the scores 0, 50 and 100 correspond to the three colors specified below. If you click "Apply Custom Tube", the selected residues will be displayed in a style similar to "B-factor Tube". Custom File: 1. Score to Color: 0: 50: 100: or 2. You can define your own reference numbers in a custom file using Excel, and then export it as a CSV file. An example file is shown below with cells separated by commas. refnum,11,12,,21,22,,10C,11C,20CThe first row defines the reference residue numbers, which could be any strings. The 1st cell could be anything. The rest cells are reference residue numbers (e.g., 11, 21, 10C, etc.) or empty cells. Each chain has a separate row. The first cell of the second row is the chain ID "1TUP_A". The rest cells are the corresponding real residue numbers for reference residue numbers in the first row. For example, the reference numbers for residues 100, 101, and 132 in the chain 1TUP_A are 11, 12, and 22, respectively. The fourth row shows another set of reference numners for the chain "1TUP_C". It could be a chain from a different structure. To select all residues corresponding to the reference numbers, you can simplay replace ":" with "%" in the Specification. For example, "%12" selects the residue 101 in 1TUP_A and the residue 111 in 1TUP_B. ".A%12" has the chain "A" filter and selects the residue 101 in 1TUP_A. Custom File: ID1: ID2: VAST+ based on VAST: VAST+ based on TM-align: All chains will be aligned to the first chain in the comma-separated chain IDs. Each chain ID has the form of PDBID_chain (e.g., 1HHO_A, case sensitive) or UniprotID (e.g., P69905 for AlphaFold structures). Chain IDs: (Note: To align chains in custom PDB files, you could load them in "File > Open File > PDB Files (appendable)" and click "Analysis > Defined Sets". Finally select multiple chains in Defined Sets and click "File > Realign Selection".) All chains will be aligned to the first chain in the comma-separated chain IDs. Each chain ID has the form of PDBID_chain (e.g., 1HHO_A, case sensitive) or UniprotID (e.g., P69905 for AlphaFold structures). Chain IDs: The sequence alignment (followed by structure alignment) is based on residue numbers in the First/Master chain: (Note: To align chains in custom PDB files, you could load them in "File > Open File > PDB Files (appendable)" and click "Analysis > Defined Sets". Finally select multiple chains in Defined Sets and click "File > Realign Selection".) All chains will be aligned to the first chain in the comma-separated chain IDs. Each chain ID has the form of PDBID_chain (e.g., 1HHO_A, case sensitive) or UniprotID (e.g., P69905 for AlphaFold structures). Chain IDs: Each alignment is defined as " | "-separated residue lists in one line. "10-50" means a range of residues from 10 to 50. Option 1: Option 2: All chains will be aligned to the first chain in the comma-separated chain IDs. Each chain ID has the form of PDBID_chain (e.g., 1HHO_A, case sensitive) or UniprotID (e.g., P69905 for AlphaFold structures). Chain IDs: Each alignment is defined as " | "-separated residue lists in one line. "10-50" means a range of residues from 10 to 50. Please specify the mutations with a comma separated mutation list. Each mutation can be specified as "[uppercase PDB ID or AlphaFold UniProt ID]_[Chain Name]_[Residue Number]_[One Letter Mutant Residue]". E.g., the mutation of N501Y in the E chain of PDB 6M0J can be specified as "6M0J_E_501_Y". For AlphaFold structures, the "Chain ID" is "A". If you load a custom structure without PDB or UniProt ID, you can open "Seq. & Annotations" window and find the chain ID such as "stru_A". The part before the underscore is the structure ID, which can be used to specify the mutation such as "stru_A_...". Remember to choose "Show Mutation in: Current Page". Mutations: ID Type: PDB IDAlphaFold UniProt ID Show Mutation in: Current PageNew Page Mol2 File: SDF File: XYZ File: URL in the same host: Multiple mmCIF Files: mmCIF ID: Note: The "biological unit" is the biochemically active form of a biomolecule, or Note: The "biological unit" is the biochemically active form of a biomolecule, BLAST search with the protein sequence ID or FASTA sequence as input. If the protein accession is not a PDB chain, the corresponding AlphaFold UniProt structure is used. Enter a protein sequence ID (or FASTA sequence) and the aligned protein accession, which can be found using the Protein Sequence ID(NCBI protein accession of a sequence): or FASTA sequence: Aligned Protein Accession (or a chain of a PDB): ESM Metagenomic Atlas. The sequence should be less than 400 characters. For any sequence longer than 400, please see the discussion here. The sequence to structure prediction is done via FASTA sequence: Protein/Gene name: PubChem CID/Name/InchI: Chemical SMILES: Share Link URL: Collection File: Structures: 2fofc contour at default threshold or at: σ fofc contour at default threshold or at: σ 2fofc contour at default threshold or at: σ URL in the same host: fofc contour at default threshold or at: σ URL in the same host: Custom Color: Grid Size: Salt Concentration: M Potential contour at: kT/e(25.6mV at 298K) Note: Only the selected residues are used for DelPhi potential calculation by solving linear Poisson-Boltzmann equation. Grid Size: Salt Concentration: M Surface with max potential at: kT/e(25.6mV at 298K) Surface: Opacity: Wireframe: Note: Only the selected residues are used for DelPhi potential calculation by solving linear Poisson-Boltzmann equation. Potential contour at: kT/e(25.6mV at 298K) Note: Always load a PDB file before loading a PQR or DelPhi potential file. Potential contour at: kT/e(25.6mV at 298K) Grid Size: Salt Concentration: M PQR URL in the same host: Phi URL in the same host: Cube URL in the same host: Note: Always load a PDB file before loading a PQR or DelPhi potential file. Symmetry: Distance: Contact Type:
4. Sort Interactions on: to show two lines of residue nodes to show map with atom details to show interactions with strength parameters in 0-200:
(Note: you can also adjust thresholds at #1 to add/remove interactions.) 5. and select new sets 1. Select sets below or use your current selection: 2. 1. Select sets below or use your current selection. 2. 1. Select sets below or use your current selection: 2. Overall maximum RMSD: Å 3. 1. Select sets below: 2. 1. Select sets below: 2. 1. Select sets below: 2. 1. Select sets below: 2. Hold Ctrl key to select multiple nodes/lines. Green: H-Bonds; Cyan: Salt Bridge/Ionic; Grey: Contacts Magenta: Halogen Bonds; Red: π-Cation; Blue: π-Stacking Scale: Hold Ctrl key to select multiple nodes. Scale: Note: Nodes/Residues can be dragged. Both nodes and dashed lines/interactions can be clicked to select residues. Color legend for interactions (dashed lines): Green: H-Bonds; Cyan: Salt Bridge/Ionic; Grey: Contacts Magenta: Halogen Bonds; Red: π-Cation; Blue: π-Stacking Scale: Hold Ctrl key to select multiple nodes. Scale: Hold Ctrl key to select multiple nodes. Scale:
Contour at: σ Contour at: σ Contour at: % of maximum EM values 1. Select the first set: 2. Sphere with a radius: Å 3. Select the second set to apply the sphere: 4. the sphere around the first set of atoms interacting/contacting residue pairs in a file 1. Extracellular membrane Z-axis position: Å 2. intracellular membrane Z-axis position: Å 3. the adjusted membranes 1. Z-axis position of the first X-Y plane: Å 2. Z-axis position of the second X-Y plane: Å 3. the region between the planes to Defined Sets 2. Size: 3. Color: 4. Pick TWO atoms while holding "Alt" key 5. 2. Size: 3. Color: 4. 1. Pick TWO atoms while holding "Alt" key 2. Line Color: 3. 1. Pick TWO atoms while holding "Alt" key 2. Color: 3. 1. Select two sets
3. 1. Select two sets
2. Line style: 3. Line radius: 4. Color: 5. Opacity: 6. 1. Select a set: 2. Shape: 3. Radius: 4. Color: 5. Opacity: 6. 1. Select sets for pairwise distances
Note: Each set is represented by a vector, which is the X-axis of the principle axes. The angles between the vectors are then calculated. 1. Select sets for pairwise angles
1. Pick TWO atoms while holding "Alt" key 2. Coil Radius: (for coils, default 0.3) Stick Radius: (for sticks, default 0.4) Cross-Linkage Radius: (for cross-linkages, default 0.4) Trace Radius: (for C alpha trace, O3' trace, default 0.4) Ribbon Thickness: (for helix and sheet ribbons, nucleotide ribbons, default 0.2) Protein Ribbon Width: (for helix and sheet ribbons, default 1.3) Nucleotide Ribbon Width: (for nucleotide ribbons, default 0.8) Ball Scale: (for styles 'Ball and Stick' and 'Dot', default 0.3) 1. Shininess: (for the shininess of the 3D objects, default 40) 2. Three directional lights: Key Light: (for the light strength of the key light, default 0.8) Fill Light: (for the light strength of the fill light, default 0.4) Back Light: (for the light strength of the back light, default 0.2) 3. Thickness: Line Radius: (for stabilizers, hydrogen bonds, distance lines, default 0.1) Coil Radius: (for coils, default 0.3) Stick Radius: (for sticks, default 0.4) Cross-Linkage Radius: (for cross-linkages, default 0.4) Trace Radius: (for C alpha trace, O3' trace, default 0.4) Ribbon Thickness: (for helix and sheet ribbons, nucleotide ribbons, default 0.2) Protein Ribbon Width: (for helix and sheet ribbons, default 1.3) Nucleotide Ribbon Width: (for nucleotide ribbons, default 0.8) Ball Scale: (for styles 'Ball and Stick' and 'Dot', default 0.3) 4. Show Glycan Cartoon: (0: hide, 1: show, default 0) 5. Show Membrane: (0: hide, 1: show, default 1) 6. Enlarge Command Window: (0: Regular, 1: Large, default 0) 1. URLs Used in Browsers Please copy one of the URLs below. They show the same result. (To add a title to share link, click "Windows > Your Note" and click "File > Share Link" again.) Original URL with commands: Lifelong Short URL:(To replace this URL, send a pull request to update share.html at iCn3D GitHub) Lifelong Short URL + Window Title:(To update the window title, click "Analysis > Your Note/Window Title".) 2. Commands Used in Jupyter Noteboook Please copy the following commands into a cell in Jupyter Notebook to show the same result. More details are at https://github.com/ncbi/icn3d/tree/master/jupyternotebook. Annotations:
Zoom: mouse wheel; Move: left button; Select Multiple Nodes: Ctrl Key and drag an Area Force on Nodes: Label Size: Internal Edges: Color each residue based on the percentage of solvent accessilbe surface area. The color ranges from blue, to white, to red for a percentage of 0, 35(variable), and 100, respectively. Middle Percentage(White): % Select residue based on the percentage of solvent accessilbe surface area. The values are in the range of 0-100. Min Percentage: % Max Percentage: % Select residue based on B-factor/pLDDT. The values are in the range of 0-100. Min B-factor/pLDDT: % Max B-factor/pLDDT: % X: Y: Z: Vector 2, X: Y: Z: The angle is: degree. 1: 5: 9: 13: 2: 6: 10: 14: 3: 7: 11: 15: Choose an Ig template for selected residues: Choose an Ig template to align with selected residues: |
||||||||||||||||||||||||||||||||||||||||||||||||||||||||||||||||||||||||||||||||||||
Click to View More Binding Site Information of This Target and Ligand Pair | ||||||||||||||||||||||||||||||||||||||||||||||||||||||||||||||||||||||||||||||||||||
Ligand Name: D-Alanine | Ligand Info | |||||||||||||||||||||||||||||||||||||||||||||||||||||||||||||||||||||||||||||||||||
Structure Description | Crystal structure of C-terminal modified Tau peptide-hybrid 3.2d with 14-3-3sigma | PDB:6FI5 | ||||||||||||||||||||||||||||||||||||||||||||||||||||||||||||||||||||||||||||||||||
Method | X-ray diffraction | Resolution | 1.70 Å | Mutation | No | [29] | ||||||||||||||||||||||||||||||||||||||||||||||||||||||||||||||||||||||||||||||
PDB Sequence |
TPLP
|
|||||||||||||||||||||||||||||||||||||||||||||||||||||||||||||||||||||||||||||||||||
☰Loading data... Dynamically generated for selected residues. Nodes can be dragged or clicked. Label: Selection: Name:
PDB ID: Option 1, search with your selection (all residues are selected by default) in the loaded structures: Option 2, search with PDB ID and chain name: PDB ID: Chain Name: Option 3, search with a PDB file: Foldseek web server. 1. your selection (all residues are selected by default) in the loaded structures to 2 (Optional). Once you see the structure neighbors, you can view the alignment in iCn3D by inputing a list of PDB chain IDs or AlphaFold UniProt IDs below. The PDB chain IDs are the same as the record names such as "1HHO_A". The UniProt ID is the text between "AF-" and "-F1". For example, the UniProt ID for the record name "AF-P69905-F1-model_v4" is "P69905". Chain ID List: BCIF/MMTF ID: PDB ID: Very high (pLDDT > 90) Confident (90 > pLDDT > 70) Low (70 > pLDDT > 50) Very low (pLDDT < 50) AlphaFold Uniprot ID: PAE Map: NCBI Protein Accession: PDB File: Multiple PDB Files: The custom JSON file on residue colors has the following format for proteins("ALA" and "ARG") and nucleotides("G" and "A"): {"ALA":"#C8C8C8", "ARG":"#145AFF", ..., "G":"#008000", "A":"#6080FF", ...} Residue Color File: The custom file for the structure has two columns separated by space or tab: residue number, and score in the range of 0-100. If you click "Apply Custom Color" button, the scores 0, 50 and 100 correspond to the three colors specified below. If you click "Apply Custom Tube", the selected residues will be displayed in a style similar to "B-factor Tube". Custom File: 1. Score to Color: 0: 50: 100: or 2. You can define your own reference numbers in a custom file using Excel, and then export it as a CSV file. An example file is shown below with cells separated by commas. refnum,11,12,,21,22,,10C,11C,20CThe first row defines the reference residue numbers, which could be any strings. The 1st cell could be anything. The rest cells are reference residue numbers (e.g., 11, 21, 10C, etc.) or empty cells. Each chain has a separate row. The first cell of the second row is the chain ID "1TUP_A". The rest cells are the corresponding real residue numbers for reference residue numbers in the first row. For example, the reference numbers for residues 100, 101, and 132 in the chain 1TUP_A are 11, 12, and 22, respectively. The fourth row shows another set of reference numners for the chain "1TUP_C". It could be a chain from a different structure. To select all residues corresponding to the reference numbers, you can simplay replace ":" with "%" in the Specification. For example, "%12" selects the residue 101 in 1TUP_A and the residue 111 in 1TUP_B. ".A%12" has the chain "A" filter and selects the residue 101 in 1TUP_A. Custom File: ID1: ID2: VAST+ based on VAST: VAST+ based on TM-align: All chains will be aligned to the first chain in the comma-separated chain IDs. Each chain ID has the form of PDBID_chain (e.g., 1HHO_A, case sensitive) or UniprotID (e.g., P69905 for AlphaFold structures). Chain IDs: (Note: To align chains in custom PDB files, you could load them in "File > Open File > PDB Files (appendable)" and click "Analysis > Defined Sets". Finally select multiple chains in Defined Sets and click "File > Realign Selection".) All chains will be aligned to the first chain in the comma-separated chain IDs. Each chain ID has the form of PDBID_chain (e.g., 1HHO_A, case sensitive) or UniprotID (e.g., P69905 for AlphaFold structures). Chain IDs: The sequence alignment (followed by structure alignment) is based on residue numbers in the First/Master chain: (Note: To align chains in custom PDB files, you could load them in "File > Open File > PDB Files (appendable)" and click "Analysis > Defined Sets". Finally select multiple chains in Defined Sets and click "File > Realign Selection".) All chains will be aligned to the first chain in the comma-separated chain IDs. Each chain ID has the form of PDBID_chain (e.g., 1HHO_A, case sensitive) or UniprotID (e.g., P69905 for AlphaFold structures). Chain IDs: Each alignment is defined as " | "-separated residue lists in one line. "10-50" means a range of residues from 10 to 50. Option 1: Option 2: All chains will be aligned to the first chain in the comma-separated chain IDs. Each chain ID has the form of PDBID_chain (e.g., 1HHO_A, case sensitive) or UniprotID (e.g., P69905 for AlphaFold structures). Chain IDs: Each alignment is defined as " | "-separated residue lists in one line. "10-50" means a range of residues from 10 to 50. Please specify the mutations with a comma separated mutation list. Each mutation can be specified as "[uppercase PDB ID or AlphaFold UniProt ID]_[Chain Name]_[Residue Number]_[One Letter Mutant Residue]". E.g., the mutation of N501Y in the E chain of PDB 6M0J can be specified as "6M0J_E_501_Y". For AlphaFold structures, the "Chain ID" is "A". If you load a custom structure without PDB or UniProt ID, you can open "Seq. & Annotations" window and find the chain ID such as "stru_A". The part before the underscore is the structure ID, which can be used to specify the mutation such as "stru_A_...". Remember to choose "Show Mutation in: Current Page". Mutations: ID Type: PDB IDAlphaFold UniProt ID Show Mutation in: Current PageNew Page Mol2 File: SDF File: XYZ File: URL in the same host: Multiple mmCIF Files: mmCIF ID: Note: The "biological unit" is the biochemically active form of a biomolecule, or Note: The "biological unit" is the biochemically active form of a biomolecule, BLAST search with the protein sequence ID or FASTA sequence as input. If the protein accession is not a PDB chain, the corresponding AlphaFold UniProt structure is used. Enter a protein sequence ID (or FASTA sequence) and the aligned protein accession, which can be found using the Protein Sequence ID(NCBI protein accession of a sequence): or FASTA sequence: Aligned Protein Accession (or a chain of a PDB): ESM Metagenomic Atlas. The sequence should be less than 400 characters. For any sequence longer than 400, please see the discussion here. The sequence to structure prediction is done via FASTA sequence: Protein/Gene name: PubChem CID/Name/InchI: Chemical SMILES: Share Link URL: Collection File: Structures: 2fofc contour at default threshold or at: σ fofc contour at default threshold or at: σ 2fofc contour at default threshold or at: σ URL in the same host: fofc contour at default threshold or at: σ URL in the same host: Custom Color: Grid Size: Salt Concentration: M Potential contour at: kT/e(25.6mV at 298K) Note: Only the selected residues are used for DelPhi potential calculation by solving linear Poisson-Boltzmann equation. Grid Size: Salt Concentration: M Surface with max potential at: kT/e(25.6mV at 298K) Surface: Opacity: Wireframe: Note: Only the selected residues are used for DelPhi potential calculation by solving linear Poisson-Boltzmann equation. Potential contour at: kT/e(25.6mV at 298K) Note: Always load a PDB file before loading a PQR or DelPhi potential file. Potential contour at: kT/e(25.6mV at 298K) Grid Size: Salt Concentration: M PQR URL in the same host: Phi URL in the same host: Cube URL in the same host: Note: Always load a PDB file before loading a PQR or DelPhi potential file. Symmetry: Distance: Contact Type:
4. Sort Interactions on: to show two lines of residue nodes to show map with atom details to show interactions with strength parameters in 0-200:
(Note: you can also adjust thresholds at #1 to add/remove interactions.) 5. and select new sets 1. Select sets below or use your current selection: 2. 1. Select sets below or use your current selection. 2. 1. Select sets below or use your current selection: 2. Overall maximum RMSD: Å 3. 1. Select sets below: 2. 1. Select sets below: 2. 1. Select sets below: 2. 1. Select sets below: 2. Hold Ctrl key to select multiple nodes/lines. Green: H-Bonds; Cyan: Salt Bridge/Ionic; Grey: Contacts Magenta: Halogen Bonds; Red: π-Cation; Blue: π-Stacking Scale: Hold Ctrl key to select multiple nodes. Scale: Note: Nodes/Residues can be dragged. Both nodes and dashed lines/interactions can be clicked to select residues. Color legend for interactions (dashed lines): Green: H-Bonds; Cyan: Salt Bridge/Ionic; Grey: Contacts Magenta: Halogen Bonds; Red: π-Cation; Blue: π-Stacking Scale: Hold Ctrl key to select multiple nodes. Scale: Hold Ctrl key to select multiple nodes. Scale:
Contour at: σ Contour at: σ Contour at: % of maximum EM values 1. Select the first set: 2. Sphere with a radius: Å 3. Select the second set to apply the sphere: 4. the sphere around the first set of atoms interacting/contacting residue pairs in a file 1. Extracellular membrane Z-axis position: Å 2. intracellular membrane Z-axis position: Å 3. the adjusted membranes 1. Z-axis position of the first X-Y plane: Å 2. Z-axis position of the second X-Y plane: Å 3. the region between the planes to Defined Sets 2. Size: 3. Color: 4. Pick TWO atoms while holding "Alt" key 5. 2. Size: 3. Color: 4. 1. Pick TWO atoms while holding "Alt" key 2. Line Color: 3. 1. Pick TWO atoms while holding "Alt" key 2. Color: 3. 1. Select two sets
3. 1. Select two sets
2. Line style: 3. Line radius: 4. Color: 5. Opacity: 6. 1. Select a set: 2. Shape: 3. Radius: 4. Color: 5. Opacity: 6. 1. Select sets for pairwise distances
Note: Each set is represented by a vector, which is the X-axis of the principle axes. The angles between the vectors are then calculated. 1. Select sets for pairwise angles
1. Pick TWO atoms while holding "Alt" key 2. Coil Radius: (for coils, default 0.3) Stick Radius: (for sticks, default 0.4) Cross-Linkage Radius: (for cross-linkages, default 0.4) Trace Radius: (for C alpha trace, O3' trace, default 0.4) Ribbon Thickness: (for helix and sheet ribbons, nucleotide ribbons, default 0.2) Protein Ribbon Width: (for helix and sheet ribbons, default 1.3) Nucleotide Ribbon Width: (for nucleotide ribbons, default 0.8) Ball Scale: (for styles 'Ball and Stick' and 'Dot', default 0.3) 1. Shininess: (for the shininess of the 3D objects, default 40) 2. Three directional lights: Key Light: (for the light strength of the key light, default 0.8) Fill Light: (for the light strength of the fill light, default 0.4) Back Light: (for the light strength of the back light, default 0.2) 3. Thickness: Line Radius: (for stabilizers, hydrogen bonds, distance lines, default 0.1) Coil Radius: (for coils, default 0.3) Stick Radius: (for sticks, default 0.4) Cross-Linkage Radius: (for cross-linkages, default 0.4) Trace Radius: (for C alpha trace, O3' trace, default 0.4) Ribbon Thickness: (for helix and sheet ribbons, nucleotide ribbons, default 0.2) Protein Ribbon Width: (for helix and sheet ribbons, default 1.3) Nucleotide Ribbon Width: (for nucleotide ribbons, default 0.8) Ball Scale: (for styles 'Ball and Stick' and 'Dot', default 0.3) 4. Show Glycan Cartoon: (0: hide, 1: show, default 0) 5. Show Membrane: (0: hide, 1: show, default 1) 6. Enlarge Command Window: (0: Regular, 1: Large, default 0) 1. URLs Used in Browsers Please copy one of the URLs below. They show the same result. (To add a title to share link, click "Windows > Your Note" and click "File > Share Link" again.) Original URL with commands: Lifelong Short URL:(To replace this URL, send a pull request to update share.html at iCn3D GitHub) Lifelong Short URL + Window Title:(To update the window title, click "Analysis > Your Note/Window Title".) 2. Commands Used in Jupyter Noteboook Please copy the following commands into a cell in Jupyter Notebook to show the same result. More details are at https://github.com/ncbi/icn3d/tree/master/jupyternotebook. Annotations:
Zoom: mouse wheel; Move: left button; Select Multiple Nodes: Ctrl Key and drag an Area Force on Nodes: Label Size: Internal Edges: Color each residue based on the percentage of solvent accessilbe surface area. The color ranges from blue, to white, to red for a percentage of 0, 35(variable), and 100, respectively. Middle Percentage(White): % Select residue based on the percentage of solvent accessilbe surface area. The values are in the range of 0-100. Min Percentage: % Max Percentage: % Select residue based on B-factor/pLDDT. The values are in the range of 0-100. Min B-factor/pLDDT: % Max B-factor/pLDDT: % X: Y: Z: Vector 2, X: Y: Z: The angle is: degree. 1: 5: 9: 13: 2: 6: 10: 14: 3: 7: 11: 15: Choose an Ig template for selected residues: Choose an Ig template to align with selected residues: |
||||||||||||||||||||||||||||||||||||||||||||||||||||||||||||||||||||||||||||||||||||
Click to View More Binding Site Information of This Target with Different Ligands |
Different Human System Profiles of Target | Top |
---|---|
Human Similarity Proteins
of target is determined by comparing the sequence similarity of all human proteins with the target based on BLAST. The similarity proteins for a target are defined as the proteins with E-value < 0.005 and outside the protein families of the target.
A target that has fewer human similarity proteins outside its family is commonly regarded to possess a greater capacity to avoid undesired interactions and thus increase the possibility of finding successful drugs
(Brief Bioinform, 21: 649-662, 2020).
Human Tissue Distribution
of target is determined from a proteomics study that quantified more than 12,000 genes across 32 normal human tissues. Tissue Specificity (TS) score was used to define the enrichment of target across tissues.
The distribution of targets among different tissues or organs need to be taken into consideration when assessing the target druggability, as it is generally accepted that the wider the target distribution, the greater the concern over potential adverse effects
(Nat Rev Drug Discov, 20: 64-81, 2021).
Human Pathway Affiliation
of target is determined by the life-essential pathways provided on KEGG database. The target-affiliated pathways were defined based on the following two criteria (a) the pathways of the studied target should be life-essential for both healthy individuals and patients, and (b) the studied target should occupy an upstream position in the pathways and therefore had the ability to regulate biological function.
Targets involved in a fewer pathways have greater likelihood to be successfully developed, while those associated with more human pathways increase the chance of undesirable interferences with other human processes
(Pharmacol Rev, 58: 259-279, 2006).
Biological Network Descriptors
of target is determined based on a human protein-protein interactions (PPI) network consisting of 9,309 proteins and 52,713 PPIs, which were with a high confidence score of ≥ 0.95 collected from STRING database.
The network properties of targets based on protein-protein interactions (PPIs) have been widely adopted for the assessment of target’s druggability. Proteins with high node degree tend to have a high impact on network function through multiple interactions, while proteins with high betweenness centrality are regarded to be central for communication in interaction networks and regulate the flow of signaling information
(Front Pharmacol, 9, 1245, 2018;
Curr Opin Struct Biol. 44:134-142, 2017).
Human Similarity Proteins
Human Tissue Distribution
Human Pathway Affiliation
Biological Network Descriptors
|
There is no similarity protein (E value < 0.005) for this target
|
Note:
If a protein has TS (tissue specficity) scores at least in one tissue >= 2.5, this protein is called tissue-enriched (including tissue-enriched-but-not-specific and tissue-specific). In the plots, the vertical lines are at thresholds 2.5 and 4.
|

KEGG Pathway | Pathway ID | Affiliated Target | Pathway Map |
---|---|---|---|
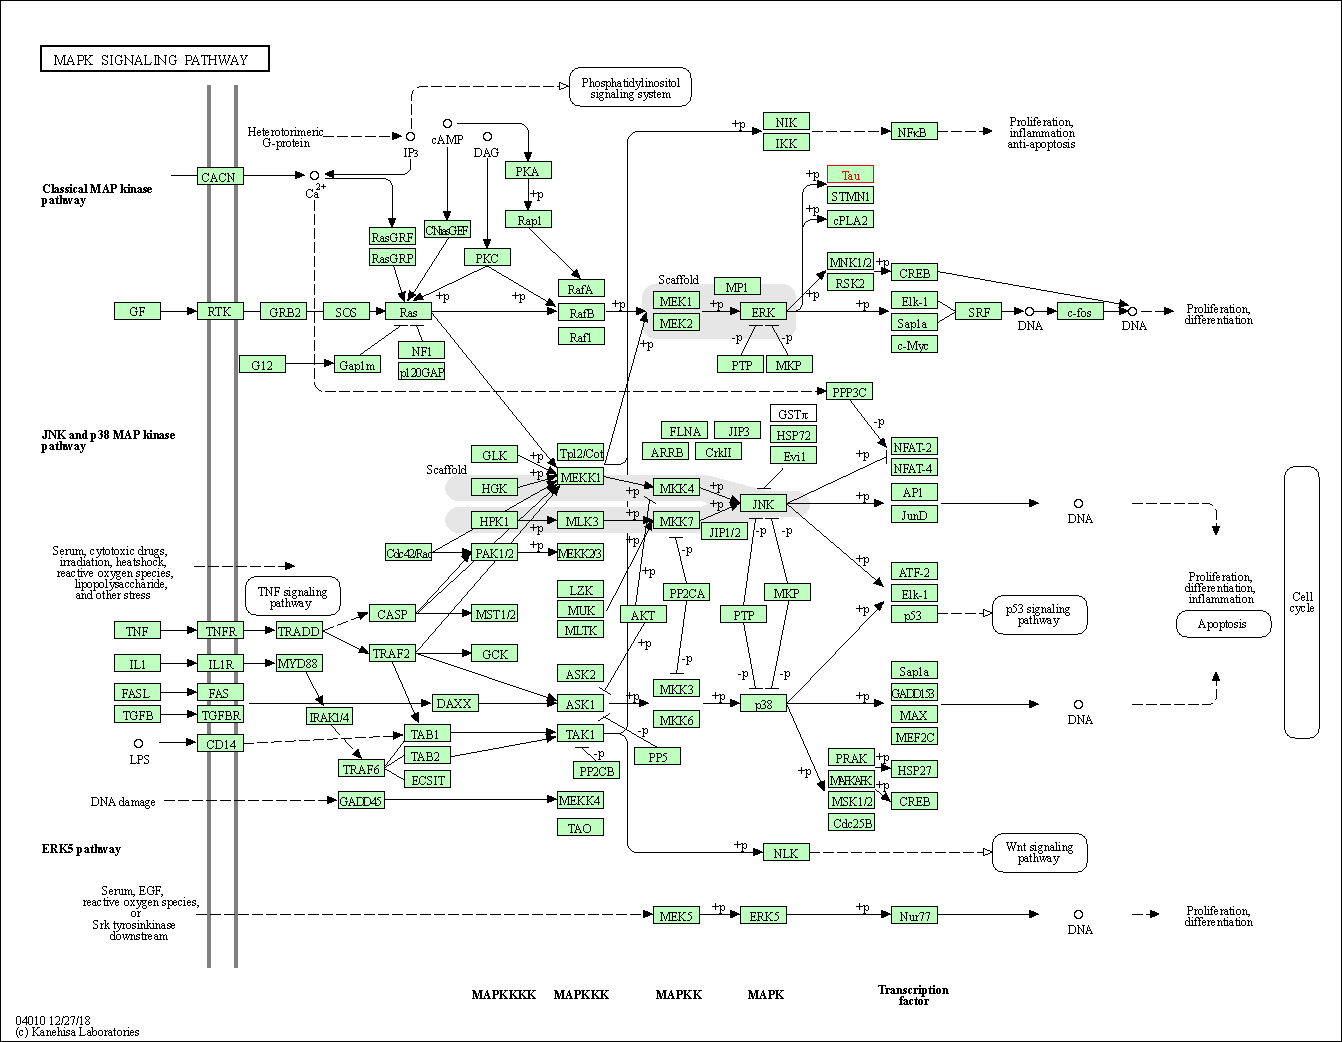
MAPK signaling pathway | hsa04010 | Affiliated Target |
![]() |
Class: Environmental Information Processing => Signal transduction | Pathway Hierarchy |
Degree | 24 | Degree centrality | 2.58E-03 | Betweenness centrality | 2.90E-03 |
---|---|---|---|---|---|
Closeness centrality | 2.44E-01 | Radiality | 1.43E+01 | Clustering coefficient | 5.07E-02 |
Neighborhood connectivity | 2.79E+01 | Topological coefficient | 5.45E-02 | Eccentricity | 12 |
Download | Click to Download the Full PPI Network of This Target | ||||
Chemical Structure based Activity Landscape of Target | Top |
---|---|
Drug Property Profile of Target | Top | |
---|---|---|
(1) Molecular Weight (mw) based Drug Clustering | (2) Octanol/Water Partition Coefficient (xlogp) based Drug Clustering | |
|
||
(3) Hydrogen Bond Donor Count (hbonddonor) based Drug Clustering | (4) Hydrogen Bond Acceptor Count (hbondacc) based Drug Clustering | |
|
||
(5) Rotatable Bond Count (rotbonds) based Drug Clustering | (6) Topological Polar Surface Area (polararea) based Drug Clustering | |
|
||
"RO5" indicates the cutoff set by lipinski's rule of five; "D123AB" colored in GREEN denotes the no violation of any cutoff in lipinski's rule of five; "D123AB" colored in PURPLE refers to the violation of only one cutoff in lipinski's rule of five; "D123AB" colored in BLACK represents the violation of more than one cutoffs in lipinski's rule of five |
Target Poor or Non Binders | Top | |||||
---|---|---|---|---|---|---|
Target Poor or Non Binders |
Target Regulators | Top | |||||
---|---|---|---|---|---|---|
Target-regulating microRNAs | ||||||
Target-interacting Proteins |
Target Profiles in Patients | Top | |||||
---|---|---|---|---|---|---|
Target Expression Profile (TEP) |
Target Affiliated Biological Pathways | Top | |||||
---|---|---|---|---|---|---|
KEGG Pathway | [+] 2 KEGG Pathways | + | ||||
1 | MAPK signaling pathway | |||||
2 | Alzheimer's disease | |||||
NetPath Pathway | [+] 2 NetPath Pathways | + | ||||
1 | IL2 Signaling Pathway | |||||
2 | EGFR1 Signaling Pathway | |||||
PID Pathway | [+] 2 PID Pathways | + | ||||
1 | LPA receptor mediated events | |||||
2 | Reelin signaling pathway | |||||
Reactome | [+] 1 Reactome Pathways | + | ||||
1 | Caspase-mediated cleavage of cytoskeletal proteins | |||||
WikiPathways | [+] 11 WikiPathways | + | ||||
1 | Notch Signaling Pathway | |||||
2 | IL-2 Signaling Pathway | |||||
3 | MAPK Signaling Pathway | |||||
4 | Copper homeostasis | |||||
5 | Kit receptor signaling pathway | |||||
6 | BDNF signaling pathway | |||||
7 | Integrated Pancreatic Cancer Pathway | |||||
8 | Alzheimers Disease | |||||
9 | Regulation of Microtubule Cytoskeleton | |||||
10 | Apoptotic execution phase | |||||
11 | IL-5 Signaling Pathway |
References | Top | |||||
---|---|---|---|---|---|---|
REF 1 | Microtubules (tau) as an emerging therapeutic target: NAP (davunetide). Curr Pharm Des. 2011;17(31):3413-7. | |||||
REF 2 | ClinicalTrials.gov (NCT01689246) Safety and Efficacy Study Evaluating TRx0237 in Subjects With Mild to Moderate Alzheimer's Disease. U.S. National Institutes of Health. | |||||
REF 3 | ClinicalTrials.gov (NCT01689246) Safety and Efficacy Study Evaluating TRx0237 in Subjects With Mild to Moderate Alzheimer's Disease. U.S. National Institutes of Health. | |||||
REF 4 | ClinicalTrials.gov (NCT05269394) A Phase II/III Multicenter Randomized, Double-Blind, Placebo-Controlled Platform Trial of Potential Disease Modifying Therapies Utilizing Biomarker, Cognitive, and Clinical Endpoints in Dominantly Inherited Alzheimer's Disease. U.S.National Institutes of Health. | |||||
REF 5 | ClinicalTrials.gov (NCT04867616) A Patient- and Investigator-Blind, Placebo-Controlled Study to Evaluate the Efficacy, Safety, and Tolerability of Bepranemab (UCB0107) in Study Participants With Prodromal to Mild Alzheimer's Disease (AD), Followed by an Open-Label Extension Period. U.S.National Institutes of Health. | |||||
REF 6 | ClinicalTrials.gov (NCT03068468) Study of BIIB092 in Participants With Progressive Supranuclear Palsy (PASSPORT). U.S. National Institutes of Health. | |||||
REF 7 | ClinicalTrials.gov (NCT04619420) A Randomized, Double-blind, Placebo-controlled, Parallel-group, Multicenter Study to Assess the Efficacy and Safety of JNJ-63733657, an Anti-tau Monoclonal Antibody, in Participants With Early Alzheimer's Disease. U.S.National Institutes of Health. | |||||
REF 8 | ClinicalTrials.gov (NCT01590888) Effect of PBT2 in Patients With Early to Mid Stage Huntington Disease. U.S. National Institutes of Health. | |||||
REF 9 | ClinicalTrials.gov (NCT03289143) A Study to Evaluate the Efficacy and Safety of Semorinemab in Patients With Prodromal to Mild Alzheimer's Disease. U.S. National Institutes of Health. | |||||
REF 10 | ClinicalTrials.gov (NCT03828747) A Phase II, Multicenter, Randomized, Double-Blind, Placebo-Controlled, Parallel-Group, Efficacy, and Safety Study of MTAU9937A in Patients With Moderate Alzheimer's Disease. U.S.National Institutes of Health. | |||||
REF 11 | ClinicalTrials.gov (NCT02414347) F 18 T807 Tau PET Imaging of Alzheimer's Disease. U.S. National Institutes of Health. | |||||
REF 12 | ClinicalTrials.gov (NCT05344989) A Phase 1, Randomized, Double-Blind, Placebo-Controlled, Single Ascending Dose Study to Evaluate the Safety, Tolerability, Pharmacokinetics, and Immunogenicity of APNmAb005 in Healthy Subjects. U.S.National Institutes of Health. | |||||
REF 13 | ClinicalTrials.gov (NCT04476303) A Randomized, Double-blind, Placebo-controlled, Single and Multiple Ascending Dose Phase I Clinical Trial to Evaluate the Safety, Tolerability and Pharmacokinetics of BEY2153 After Oral Administration in Healthy Young and Elderly Male Volunteers. U.S.National Institutes of Health. | |||||
REF 14 | ClinicalTrials.gov (NCT04149860) Interventional, Randomized, Double-blind, Placebo-controlled, Single-ascending-dose Study Investigating the Safety, Tolerability, and Pharmacokinetic Properties of Lu AF87908 in Healthy Subjects and Patients With Alzheimer's Disease. U.S.National Institutes of Health. | |||||
REF 15 | Clinical pipeline report, company report or official report of the Pharmaceutical Research and Manufacturers of America (PhRMA) | |||||
REF 16 | Clinical pipeline report, company report or official report of Prothena | |||||
REF 17 | Trusted, scientifically sound profiles of drug programs, clinical trials, safety reports, and company deals, written by scientists. Springer. 2015. Adis Insight (drug id 800028705) | |||||
REF 18 | Clinical pipeline report, company report or official report of TauRx. | |||||
REF 19 | Clinical pipeline report, company report or official report of the Pharmaceutical Research and Manufacturers of America (PhRMA) | |||||
REF 20 | Mechanisms of Anticholinesterase Interference with Tau Aggregation Inhibitor Activity in a Tau-Transgenic Mouse Model. Curr Alzheimer Res. 2020;17(3):285-296. | |||||
REF 21 | Pre-clinical characterisation of E2814, a high-affinity antibody targeting the microtubule-binding repeat domain of tau for passive immunotherapy in Alzheimer's disease. Acta Neuropathol Commun. 2020 Feb 4;8(1):13. | |||||
REF 22 | Immunotherapy for Alzheimer's disease: targeting beta-amyloid and beyond. Transl Neurodegener. 2022 Mar 18;11(1):18. | |||||
REF 23 | PBT2 rapidly improves cognition in Alzheimer's Disease: additional phase II analyses. J Alzheimers Dis. 2010;20(2):509-16. | |||||
REF 24 | Antibody semorinemab reduces tau pathology in a transgenic mouse model and engages tau in patients with Alzheimer's disease. Sci Transl Med. 2021 May 12;13(593):eabb2639. | |||||
REF 25 | Clinical pipeline report, company report or official report of Aprinoia Therapeutics | |||||
REF 26 | Clinical pipeline report, company report or official report of BeyondBio | |||||
REF 27 | Clinical pipeline report, company report or official report of Lundbeck | |||||
REF 28 | Biopharmaceutical Research Companies Are Developing More Than 430 Medicines for Top Chronic Diseases Affecting Older Americans. Pharmaceutical Research and Manufacturers of America report. 2014. | |||||
REF 29 | Inhibition of 14-3-3/Tau by Hybrid Small-Molecule Peptides Operating via Two Different Binding Modes. ACS Chem Neurosci. 2018 Nov 21;9(11):2639-2654. |
If You Find Any Error in Data or Bug in Web Service, Please Kindly Report It to Dr. Zhou and Dr. Zhang.